Ielts Writing Task 1_ Water usage
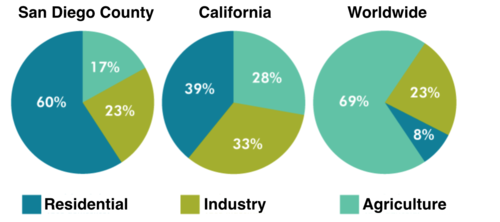
The pie charts show the comparison of water usage in different regions: San Diego, California and the rest of the world.
As can be seen from the graphs, San Diego and California shared the same pattern with the greatest percentage of water used for residential purposes and the smallest for agriculture, which was opposite with the other countries. There was no significant difference in water usage for industry in San Diego, California and the rest.
Both in San Diego and California, residents consumed most of the water, respectively at 60% and 39% of the total water use. The amount of water served for industrial activities in the two regions ranked second, with 23% in San Diego and 33% in California. Agriculture made up the smallest proportion which was 17% in San Diego. This figure was 28% - a little higher in California.
By contrast, in the other parts of the world, water was used most for agricultural purposes. It amounted to 69% of the total water usage. Meanwhile, the residential water use accounted for an insignificant 8% compared with the other purposes and compared with San Diego and California. There was 23% of water used in industry, which was similar to San Diego and only 10% less than California.

6a0120a5bb05d8970c01.png
