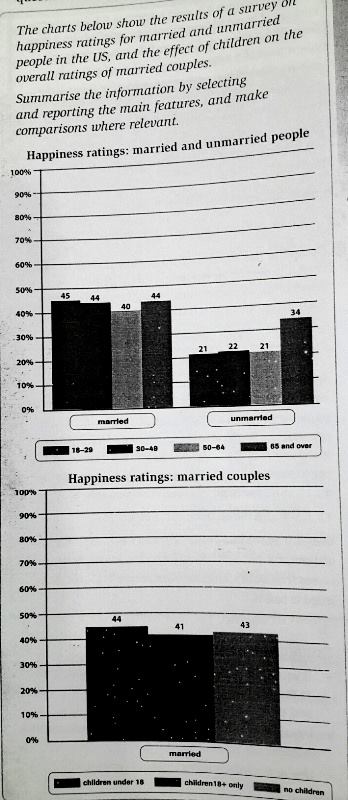
Those two bar charts provide information about the percentage of happiness levels for married and unmarried people in the US and the effect of children on happiness ratings of people who have married. Overall, it can obviously be seen that married couple are happier than the unmarried. For married couple, the highest happiness level belongs to the couple who have children under 18 years of age.
To begin, married couples has roughly above 40% of their happiness ratings in which couples in the 18-29 age group are the happiest couple among others (45%). The outstanding figure among single people categories is people aged over 65 (34%) while people 18-29 and 50-64 years of age have the lowest percentages which are 21% in both categories.
With regard to the levels of happiness of married couples, all of age groups do not have significant gap. The figures are more than 40% for each category. Couples who have children under 18 years of age are the happiest. They have 44% while couples having children above aged 18 and couple who do not have children are 41% and 43% respectively.

262487_1_o.jpg
