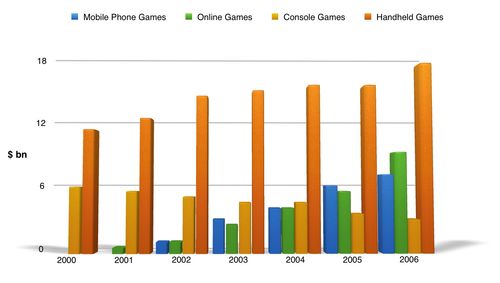
The bar chart illustrates the four different types of digital game that was sold during the period from 2000 to 2006.
It is worth mentioning that handheld games were the highest throughout the period. All the given categories except console games showed a rising trend in the sales over the period.
In particular, console games became the least popular digital game from being at the second place. There was a gradual decrease from 6 billion to 3 billion dollars. Meanwhile, online games grew steadily from 1 billion to 9 billion dollars. This rise was particularly noticeable between 2003 and 2006, during which time the sales of online games tripled.
On the other hand, the sales of handheld games and mobile phone games showed a similar pattern of a steady growth. The figure for mobile phone games increased slowly from around 2 billions in 2000 to 7 billions in 2006, while that for handheld games went through slight rise from approximately 11 billion dollars in 2000 to just under 18 billion dollars.

6a0120a5bb05d8970c01.jpg
