Unanswered [1]
  

Home / Writing Feedback   % width   Posts: 3


Consumer devices in the UK IELTS task 1 : The table chart


ngocdn 1 / -  
Feb 22, 2019   #1

electronic devices in British households


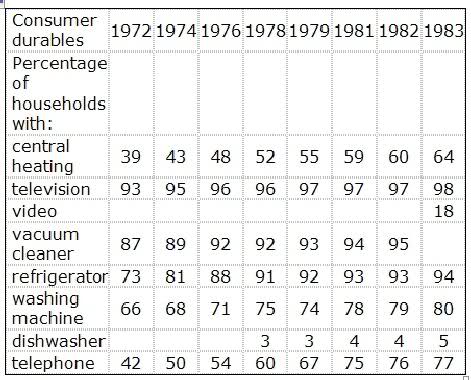
The given table illustrates the percentage of consumer devices owned by British people between 1972 and 1983.
As is revealed the graph, overall, it is obvious that television had always been popular and the reversal was true for dishwasher during the surveyed period.

To be more specific, television and vacuum cleaner obtained the dominant position of household in Britain throughout the time frame. The number of British people used television was 93% in 1972, more twofold higher than that of central heating. The figures for both groups gradually increased each year and reach the highest proportion at 98% and 95% in the final year, respectively. Ranked as the second groups after TVs and vacuum cleaner, refrigerator, and washing machine experienced a significant rose to 94% and 80% in 1983, respectively, from the first data in 1972.

By contrast, dishwasher and video was the least favorite durable from 1972 to 1983. 3% of citizens British began using the dishwasher in 1978 and reaching a maximum of 5% in 1983. In addition, the video became owned by British people since 1983, and only 18% of these people used it. Moreover, the other product, include central heating and telephone steadily grew. In this case, the percentage of central heating was 64% in 1983, more approximate double higher than that of the first year surveyed.

Because I'm going to take the real test next month so please give me the most detailed feedback and a band score.

  • tele.jpg


ngothanhnam2211 4 / 5  
Feb 23, 2019   #2
I am not an IELTS teacher but I hope I can help you in some ways

As is revealed in the graph

... position of household devices in Britain

... the least favorite durable (wrong word) from 1972 to 1983.
In addition, the video became owned by British people (People had started purchased video since 1983, and only 18% of these people used it. ... was 64% in 1983, more approximate double (wrong word -> two times) higher than ...
Holt  Educational Consultant - / 15460  
Feb 23, 2019   #3
Ngoc, the whole essay shows that you do not understand how to use connecting words to create an understandable essay in English. You have to learn when to use the words "the, in, and, an, a, because" and a host of other connecting words that help to connect the ideas and topics in your sentence and paragraph presentations. Let me show you samples of where you made these mistakes:

As is revealed the graph = ... revealed IN the graph

You also need to present a more comprehensive summary overview that includes not only the type of graph used topic, and inclusive years, but also the type of measurements and items being measured. When possible, include the source of the information as well.

For a task 1 essay, I have to say that you wrote too many words. You should only spend 20 minutes on this task so the logical number of written words should be around 150-200 words only. There is a lack of trending sentence and an additional paragraph to make the essay a properly formatted Task 1 essay. The Task 1 essay should have 4 paragraphs in it.

You did a good job of explaining the content of the graph. The main problem you have is in the formatting and use of connecting words so make sure to study the methods by which you can correct those mistakes and apply them to the next practice essay.


Home / Writing Feedback / Consumer devices in the UK IELTS task 1 : The table chart
ⓘ Need Writing or Editing Help?
Fill out one of these forms for professional help:

Best Writing Service:
CustomPapers form ◳

Graduate Writing / Editing:
GraduateWriter form ◳

Excellence in Editing:
Rose Editing ◳

AI-Paper Rewriting:
Robot Rewrite ◳