Unanswered [17] | Urgent [0]
  

Home / Writing Feedback   % width Posts: 2


IELTS WRITRING TASK 1: The chart below shows the amount spent on six consumer goods in four European


Qaan 1 / -  
Dec 2, 2023   #1
The bar chart illustrates the expenditure of people in Britain, France, Italy and Germany on six different products.

Overall, British people allocated significantly more money on six items than the three other European countries mentioned on the chart. While photographic film is the most popular commodity among the six products.

People in Britain consumed the highest number of photographic film, toys, and CDs, with spending at nearly £175,000, £170,000, and £160,000 respectively. Followed by French and Italians with an average spending amount of approximately £150,000, whilst Germans paid out less than £150,000 for each product.

Regarding the less three popular goods (perfumes, tennis racquets, personal stereos), Italy and Britain have the higher overall expenditure on these items, at roughly £150,000 in comparison to the figures for spending by French and Germans. With around £145,000 spent on tennis racquets, it is the lowest figure shown on the chart.

***Dear Teachers & Friends,***
Please help to read and evaluate my essay, I'm starting learning writing skills and really appreciate your feedback
Thank you!!!
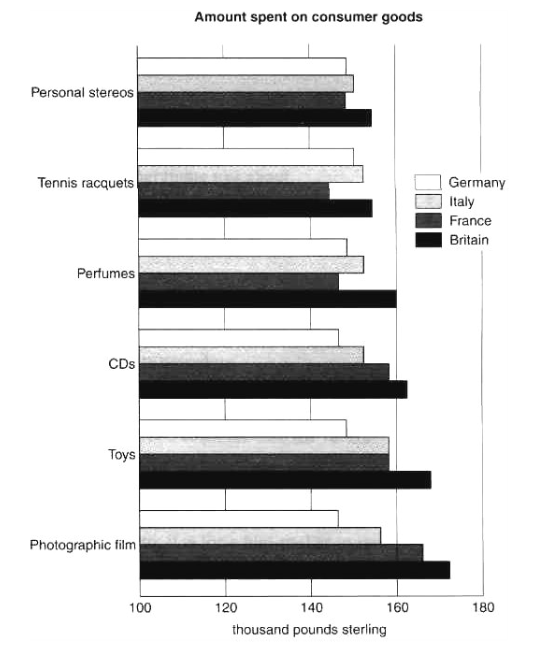

  • The Bar Chart
Holt  Educational Consultant - / 14,835 4783  
Dec 8, 2023   #2
six different products.

The summary overview requires you to give a short listing of the information provided, which will be discussed in the body of the essay. Where is the reference to the amount spent and measured? It was indicated in the bar graph but you did not mention it. So you should have listed the 6 products in the summary overview. Afterall, the summary overview requires you to write at least 2 sentences to gain a proper score.

Regardless of the problem with your summary overview, the body of the report is actually quite good. It is clear and analytical. It offers an insight into the discussion along with the values, it basically offers a good reference point for the reader to consider.


Home / Writing Feedback / IELTS WRITRING TASK 1: The chart below shows the amount spent on six consumer goods in four European
Writing
Editing Help?
Fill in one of the forms below to get professional help with your assignments:

Graduate Writing / Editing:
GraduateWriter form ◳

Best Essay Service:
CustomPapers form ◳

Excellence in Editing:
Rose Editing ◳

AI-Paper Rewriting:
Robot Rewrite ◳