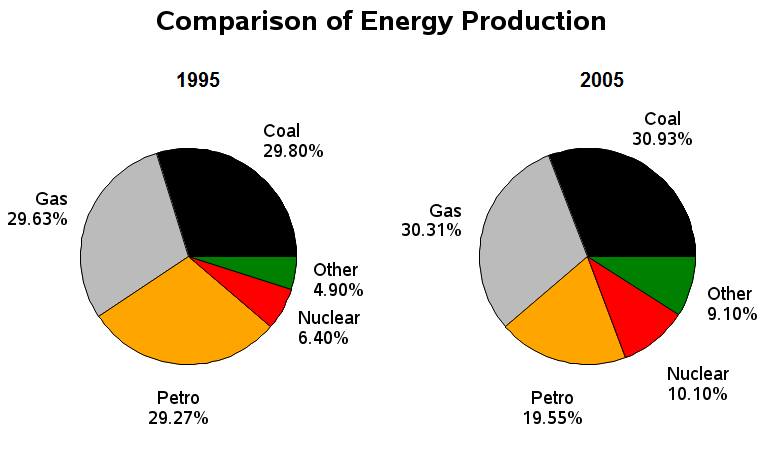
The pie charts shows compare kinds of energy in france between 1995 and 2005. Overall the highest energy had been coal and the lowest was other steam.
According charts highest type potency both years was coal, more than a third, while the minority was other sources at 4.90%. The highest in 1995 was coal, less than a third and the smallest was nuclear at 6.40%. while, the biggest in 2005 was coal at 30.93%, reversed was other energy 9.10%.
Comparing the two groups, gas and coal increased between 1995 and 2005 approximately 1%. Not only above, nuclear has rise around 3% and gas 1%, it was seem france have good potential source. While, Potential energy in france not only improved but it had decrease in petro circa 9%. Most item had increased but the extremely icrease is other power, roughly 4% and the smallest is petro plunged to on the order of 10%.

energy_pie_chart.jpg
