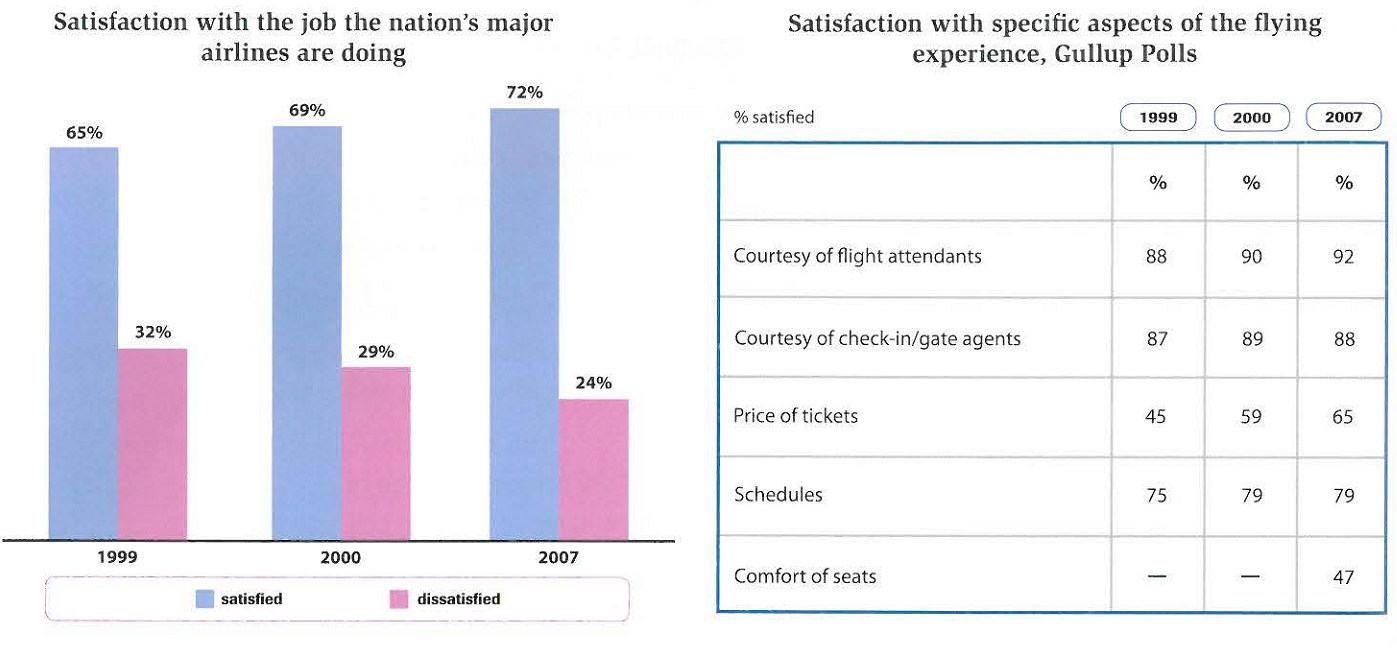
The chart and table below show customer satisfaction levels in the US with airlines and aspects of air travel in 1999, 2000 and 2007.
The bar chart provides information about how satisfy customers used the service from nation's major airlines in 1999, 2000, and 2007. The table shows several factors that affected customers' satisfaction of the flying experience. Overall, passengers' satisfaction had an upward trend during the period. Courtesy of the flight attendant was the most aspect that affected customers' convenience. There was an upward trend too in each aspect each year.
To start with, there was 65% of satisfaction level of passenger using the airlines and the dissatisfaction reached 32% in 1999. In the following year, passengers 'convenience increased to 60% while the inconvenience decreased to 29%. The percentage of the customers' happiness peaked at 72. It was followed by declining of unhappiness to 24 percent in 2007.
There were five aspects that affected passengers' satisfaction of the flying experience based on Gullup polls. Satisfaction of customers was mostly influenced by courtesy of flight attendant between 1999 and 2007 from 88 to 92 percent. The third larger factor was ticket prices that increased by 20% during the period. Courtesy of check-in agents and flight schedules had the insignificant number of changing which the increasing number around 1-2 percent each year. The comfort seat did not influence mood of passenger in 1999 and 2000. However, in 2007, it had 47% of satisfaction level. 219w

table and chart
