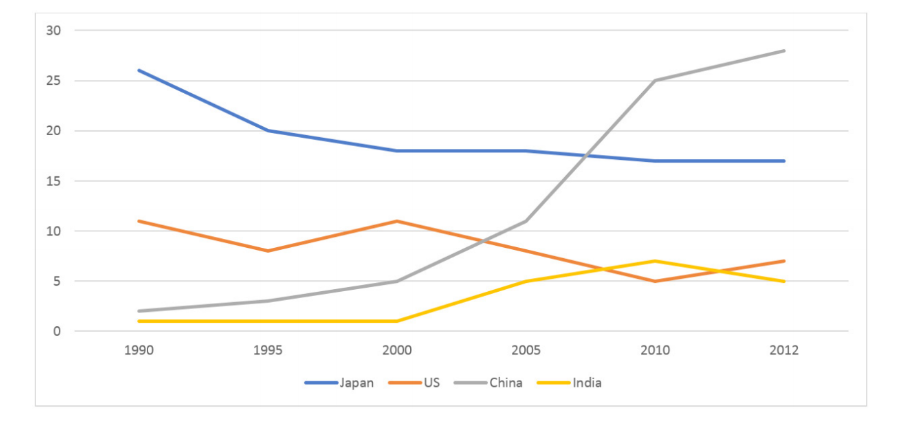
Australian exports numbers to four countries from 1990 to 2012
The graph depicts how many percentages of Australia exports to 4 different regions: Japan, US, China and India over a period of 22 years (1990 - 2012).
Overall, there were upward trends in the proportion of Australian exports to China and India while the opposite was true for the other categories over the given period. Besides, China easily outnumbered all other figures during this time.
In 1990, China and India received the ratio of Australian exports bottomed at just under 5% until the 2000s. Previously, this ratio of India hovered around the level of only about 1%. From 2000 to 2010, it increased significantly by about 6% before hitting a slight drop from 7% to 5% in 2012. During the same period, the percentages of Australian commodities exported to China witnessed a surge and overtook the figure of Japan in 2007 to become the largest market that obtained all of the exported goods with 28% in 2012.
Regarding the other two countries, a gradual decline of about 10% was seen in the portion of Australian exports to Japan between 1990 and 2012. Meanwhile, this percentage of the US entered a two-decade period of instability when reached the highest point at 12% in 2000 and fell to the lowest point of only a mere 5% in 2010.

Picture1.png
