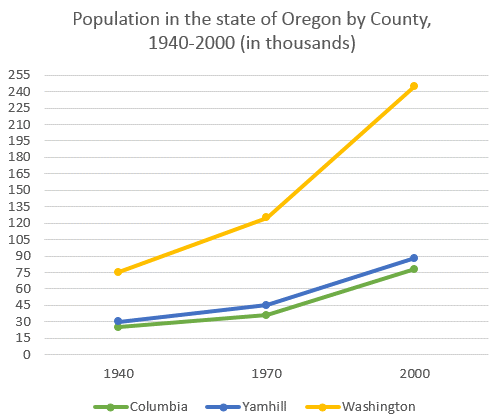
The line graph gives information about the demographic growth, In thousands, starting from 1940 to 2000 in three kinds of regions in the US state of Oregon. It is noticeable that that while in the whole period displayed a rising number of population in all counties, Washington showed the highest population and similar pattern occurred in the others with Columbia witnessing the lowest figure.
In 1940, the most crowded city was Washington, at 75 thousand, and much fewer people wanted to live in Columbia, only about 25 thousand. 30 years later, population in Washington leveled up dramatically to approximately 128 thousands. Slight improvements were shown in Columbia and Yamhill, spotted at 32 thousand and 45 thousand respectively.
In the end of the period, the sequence had not altered with Washington still breaking a record at 248 thousand. Interestingly, the number of citizens in Columbia and Yamhill went up gradually by virtually the same figure, at roughly 12 thousand.

Line Graph
