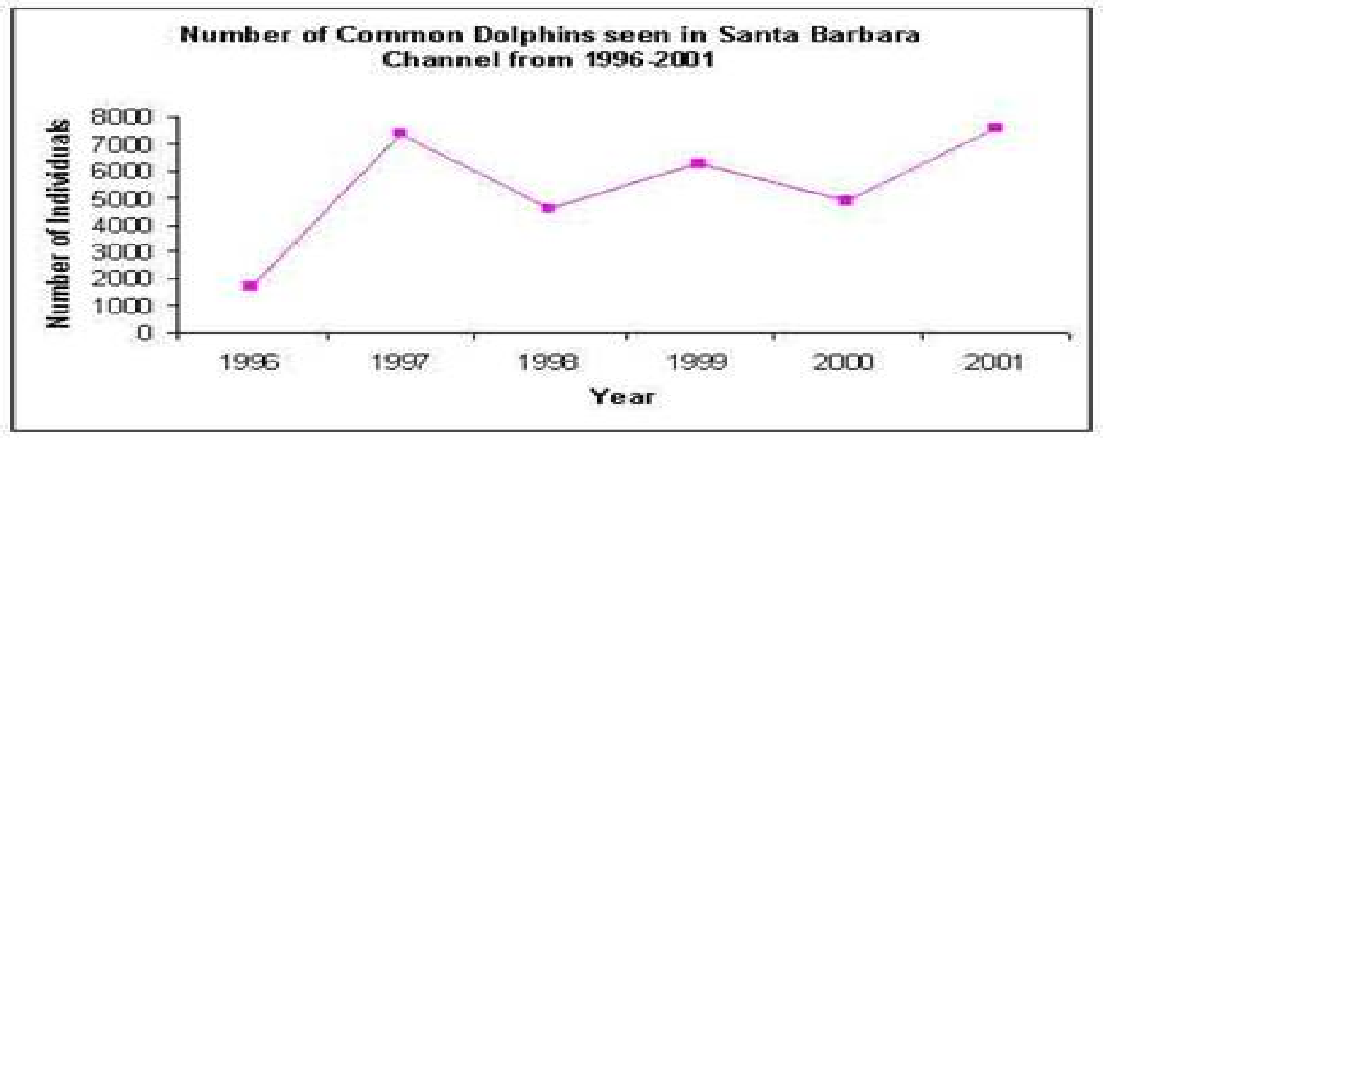
Describe a graph about the number of common Dolphins seen in Santa Barbara Channel from 1996-2001.
number of Dolphins in Santa Barbara
This line graph describes the number of common Dolphins seen in Santa Barbara Channel from 1996-2001.
Overall, there was a variation of the number over the period. In 1996, approximately 1500 Dolphins can be seen and one year later, the number reached about 7500. But in 1998, it went down considerably to about 4000. In 1999, It went up to the number of 6000 and decreased again to the number of 4000. In the final year, the number reached about 7000.

Untitled.png
Holt Educational Consultant - / 16008 This type of data reporting or summary presentation will not get a passing score in an actual test. Why? Well, for starters, the minimum word count is 150 words. You only wrote 81 words. That means you will lose a certain percentage of TA points for not writing the minimum word count. The large percentage of deductions in your TA presentation will result in an automatic TA failing score. Which, unfortunately, means that you will not be able to catch up with the remaining scoring considerations for you to be able to get a passing score. I am sorry about that. I will not be able to help you beyond this point because of the lack of proper paragraph presentations. Please write a new essay that presents the standard 3 paragraph presentation composed of 1 summary overview and 2 information detail paragraphs. Once you write a new essay that meets the minimum paragraph and word count requirements, I will be able to properly assess your essay and offer useful recommendations for improvement.
| Home / Writing Feedback / Describe a graph about the number of common Dolphins seen in Santa Barbara Channel from 1996-2001. |
ⓘ Need academic writing help? 100% custom and human!

