forest area - diagram analysis
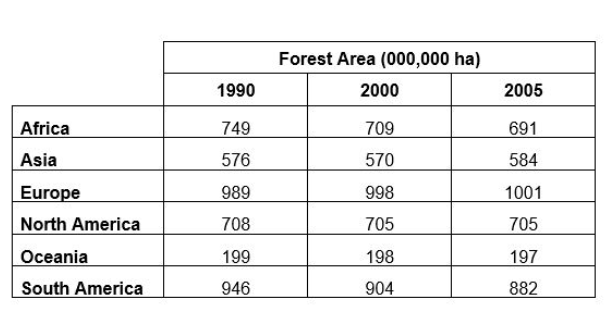
The table shows forested land in millions of hectares in different parts of the world.
Summarise the information by selecting and reporting the main features, and make comparisons where relevant.
You should spend about 20 minutes on this task.
my essay:
The diagram indicates forest area of different districts around the world in 1990, 2000 and 2005.
Apparently, forest area of Oceania is the least and Europe has the largest forest land. We can also find that the area of forest land in South America and Africa decreased a lot from 1990 to 2005.
It is clear that the total area of woods in Oceania in 1990, 2000 and 2005 has never been over 200 millions of hectares which is far less than woods areas of other districts. The area of European forest in 1990, 2000 and 2005 is around 1000 millions of hectares which is the most among all districts.
We can see that in 1990 the forest land area of South America is 946 millions of hectares. However, in 2005 it drops to 882 millions of hectares. African forests were faced with the same issue: from 1990 to 2005, its area went down from 749 to 691 millions of hectares.
THANKS FOR YOUR HELP!

2.PNG
