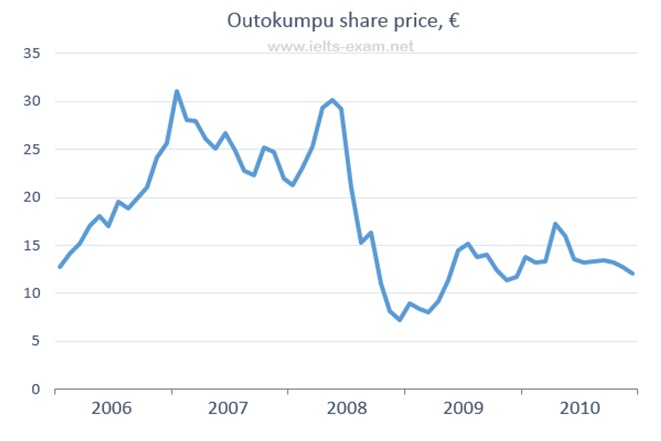
A description of change in the share cost of Outocompu Enterprises in European Countries measured in Euro from January to December 2010, a one year period is presented in line graph. The main facts that stand out reveals that notwithstanding some fluctuation shown over the give period, there were two peak times in the middle of 2006 and early 2008.
The figure stood at roughly 13 Euros in the initial year. However, there were some fluctuations in 2006 which was followed by sharp increase accounting for 30 in the middle of this period. 2007 witnessed unstable trend among art of this frame time but it was continued by a significant revive in the early subsequent year at exactly 30 Euros.
Next, the rate then suddenly dropped hitting a trough at approximately 8, which was the lowest point ever obtained. Over remaining two years, 2009 and 2010, the pattern changed erratically and ended rebounding to the initial level.

Outokumpu.jpg
