The diagrams below give information on transport and car use in Edmonton.
Summarize the information by selecting and reporting the main features, and make comparisons where relevant.
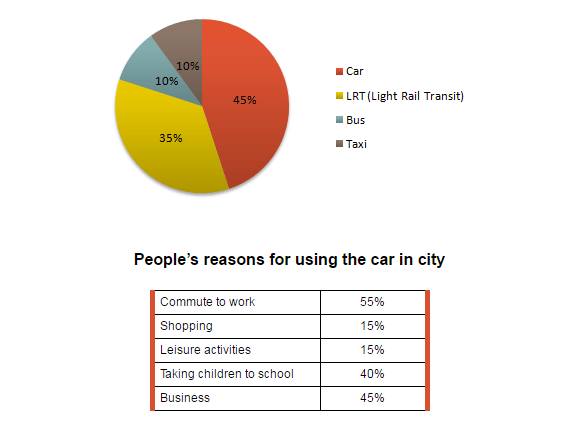
The pie chart illustrates the percentage of using four transportation in Edmonton; and the table gives information about the proportion of possible reasons that why cars are used by citizens. Overall, it can be seen that car was the greatest used while commute to work was the biggest reason people used it.
Concerning to the kinds of transports in pie chart, car showed the biggest used which took place more than two fifths of all transportations. At 35%, Light Rail Transit was the second most popular transport to use. In addition, both Bus and Taxi had similar patterns which were the lowest transportation that stood at only one in ten.
Coming the second to several reasons inhabitants used car in the table, commute to work was the most possible reason which peaked more than half. Business and Taking children to school were the second most largest motives societies used it that were at 45% and 40% in order. However, Shopping and Leisure activities were the last reasons, both were at 15%.

12592507_10204376341.jpg
