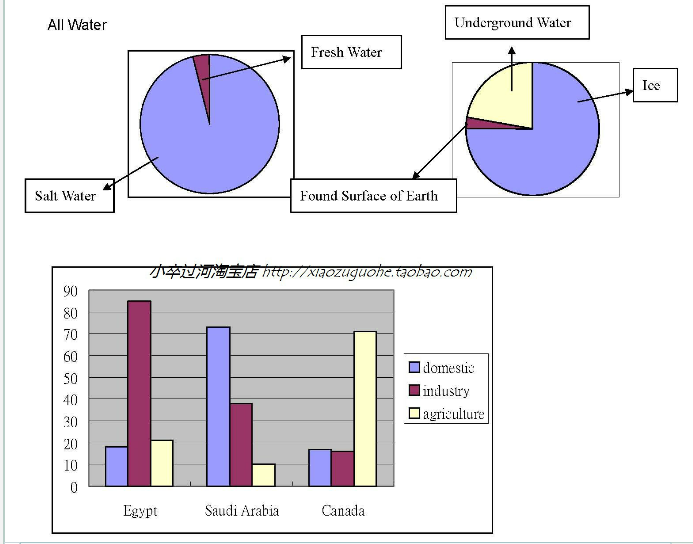
ESSAY: The diagrams below show the various kinds of water found on the earth and how it is used in three different countries.Write a report for a university lecture the information shown below.
The pie charts give the detailed information regarding to the 3 different kinds of water resources and the bar diagram compares the water consumption in 3 independent countries.
As is illustrated from two pie charts, we can see immediately that the majority of water existing on the earth are salt water while, there is only a minimal proportion of earth water is fresh water which is suitable for people to drink. Additionally, the largest proportion of water are out of ice, accounting for almost 75%, followed by underground water(about 30%). The surface of earth can merely be found the least percentage of water(10%).
Moving onto the next diagram, through the comparison of figures of 3 respective countries, Egypt consumes the largest percentage of water on industry, amounting to approximately 85%, that also exceeds the figures of Saudi and Canada which are nearly 40% and 18% respectively. In addition, Saudi applied water mainly into domestic use which makes up 72%, while the data of Egypt and Canada are less than 10%. Finally, in terms of agricultural use, compared with Egypt(20%) and Saudi( only 10%), Canada allocated totally 70% to irrigate arable lands.
To conclude, the resource of fresh water is very limited and the major purposes of water utilization in three countries varies a lot, Egypt is for industry use, Saudi for domestic use and Canada for agriculture.

QQ20160423212837.p.png
