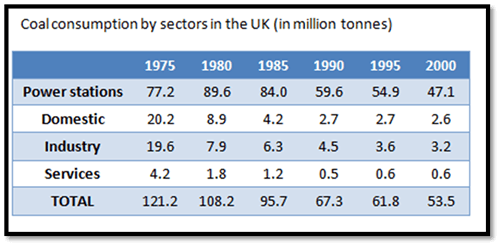
Coal consumption divided into four sectors in UK between 1975 and 2000 can be seen in the table. Units are measured in millions tonnes. It is important to note that figure for coal consumption showed downward trend for all the sectors. In contrast, services was very low coal consumption among others.
During 25 years, the was a dramatic fall in the coal consumption. However, power stations broke the record as the highest coal consumption, at 89,6 millions tonnes among others . Domestic and industri were fairly similar coal usage over the period. In the early term presented domestic the second most coal consumption but in 2000 showed industry (3,2 millions tonnes) was higher coal consumption then domestic.
In contrast, services until the end period described the lowest coal consumption. There witnessed a sharp fall in the number of coal consumption over the period. In 2000 number for coal consumption is only 0,6 millions tonnes. Finally, all of coal consumption for four sectors in 2000 showed nearly a half from 1975.

IELTSAcademicTask.png
