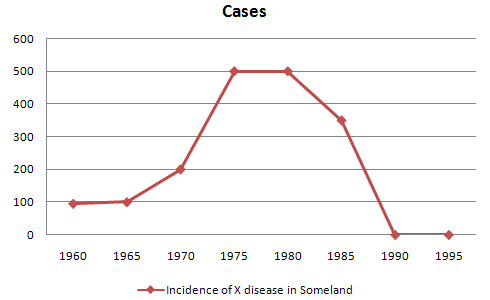
The line graph illustrates the change number regarding the cases of X disease occurring over 35 years in Someland from 1960 to 1995.
As an overall trend, some periods over those years experienced stable at case numbers while other showed either increase or decrease.
A more detailed look at the graph shows X disease attacked 100 humans between 1960 and 1965, then this number doubled in the following five years. A worse situation happened during a half decade after the end of this particular period, in 1970, as X boomed by 300 cases. However, this number did not undergo a change until 1980.
Following this, fortunately, the condition was getting significantly better in the following period. In 1985, this illness case number declining to 350, indicated the situation was almost 30 percent better than before. A tremendously great fact happened between 1990 and 1995 when X eradicated totally in this city.

G59.gif
