Hello all,
Please check out the essay for me. I am sincerely thankful for anyone who can provide any advice or suggestions. If possible, please give me detailed marks and score the essay as well. Thank you so much.
QUESTION
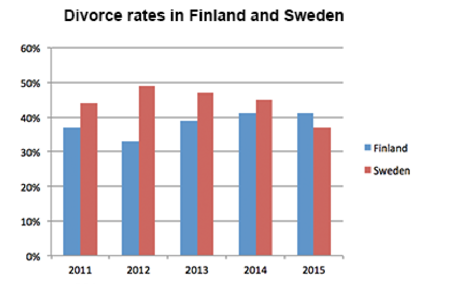
The bar chart shows the divorce rates in two European countries from 2011 to 2015.
Summarise the information by selecting and reporting the main features, and make comparisons where relevant.
ESSAY
The given bar illustrates the percentages of divorce rates in two European nations (Finland and Sweden) between 2011 and 2015. Overall, the number of divorce rates in both countries were all over 30% during this five years. The data in Sweden were higher than in Finland despite a marginal dip in the year of 2015.
In 2012, it is notable that the percentage of divorce rate in Sweden reached a peak at approximately 50% indicating the largest gap of 17% in contrast to the number in Finland, with around 33% of divorce rate. Within this five years, the rates in Sweden were all roughly between 35% and 50%, while in Finland, the data was only in the range between 30% and 40%, implicitly showing that there were more divorced people in Sweden during the period.
However, the gap of the rates in those two countries had decreased by about 4% by 2015, with 37% in Sweden and 41% in Finland. The divorce rates, hence, were inclined to rise up in Finland, while the ones tended to decrease in Sweden.
--
I am wondering
1. if there is any problem with my essay structure?
2. if the detail data is provided too less? For instance, I didn't write down every Sweden's percentage from 2011 to 2015 chronologically.
Please check this for me because I couldn't find any person around me to correct the essay or advise me. This website is the one I found that it might help me a lot.
Please check out the essay for me. I am sincerely thankful for anyone who can provide any advice or suggestions. If possible, please give me detailed marks and score the essay as well. Thank you so much.
QUESTION
The bar chart shows the divorce rates in two European countries from 2011 to 2015.
Summarise the information by selecting and reporting the main features, and make comparisons where relevant.
Divorce statistics in two Scandinavian countries
ESSAY
The given bar illustrates the percentages of divorce rates in two European nations (Finland and Sweden) between 2011 and 2015. Overall, the number of divorce rates in both countries were all over 30% during this five years. The data in Sweden were higher than in Finland despite a marginal dip in the year of 2015.
In 2012, it is notable that the percentage of divorce rate in Sweden reached a peak at approximately 50% indicating the largest gap of 17% in contrast to the number in Finland, with around 33% of divorce rate. Within this five years, the rates in Sweden were all roughly between 35% and 50%, while in Finland, the data was only in the range between 30% and 40%, implicitly showing that there were more divorced people in Sweden during the period.
However, the gap of the rates in those two countries had decreased by about 4% by 2015, with 37% in Sweden and 41% in Finland. The divorce rates, hence, were inclined to rise up in Finland, while the ones tended to decrease in Sweden.
--
I am wondering
1. if there is any problem with my essay structure?
2. if the detail data is provided too less? For instance, I didn't write down every Sweden's percentage from 2011 to 2015 chronologically.
Please check this for me because I couldn't find any person around me to correct the essay or advise me. This website is the one I found that it might help me a lot.

Divorce_rates_Bar_c.png
