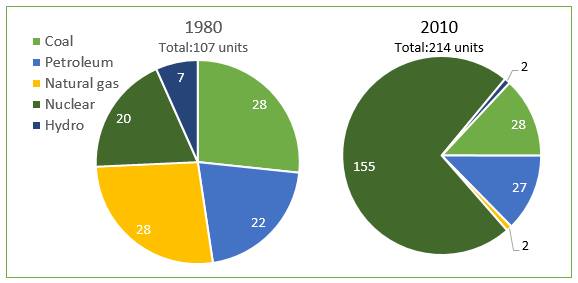
A comparison of the number of electricity generators which are divided by five categories of sources between 1980 and 2010 in Germany and it measured in unit is depicted in the picture. Overall, it can be seen that the figure for Nuclear and Petroleum to produce power in the city increased gradually while the Hydro and Natural gas number fell down in the end period of survey.
Some pie char showed dramatic changes some from 1980 to 2010. The rate of nuclear generator rose significantly by 135. However, the number of Natural gas was a sudden dropped to 2 in and the number is the same number with the Hydro source. In another case, the number of coal remained constant at 28 units. 2010 experienced that the number of Petroleum climbed slowly by 5. In contrast, the same rate of gape whit the previous resource happened in the number of Hydro.
Some pie char showed dramatic changes some from 1980 to 2010. The rate of nuclear generator rose significantly by 135. However, the number of Natural gas was a sudden dropped to 2 in and the number is the same number with the Hydro source. In another case, the number of coal remained constant at 28 units. 2010 experienced that the number of Petroleum climbed slowly by 5. In contrast, the same rate of gape whit the previous resource happened in the number of Hydro.

944996_1020133978825.jpg
