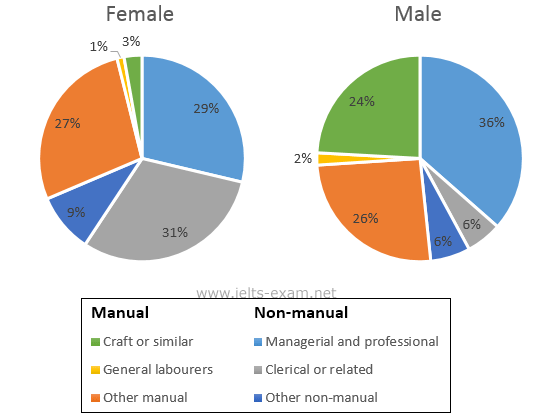
The two pie charts provide a breakdown information of the employment patterns of Great Britain, in 1992. Both charts were measured in percentage. If analyzed, the data suggest that male superior than women when it comes to Managerial and Professional and Craft or similar, while the woman had an advantage of General laborers, Clerical or related, other non-manual and manual.
When it comes to males in 1992, specifically, Managerial and Professional, they possessed 36 percent, whereas this value is higher than a woman's one for 7 percent. Clerical or related had another story, the opposite gender of male experienced 31 percent, but the male had only 6 percent. Other manual had the same story, women were recorded 27%, and this is 1 percent higher than a male's one. Both genders which are female and male, stood at 9 percent and 6 percent, when it comes Other non-manual. Male totally vanquished females if the story was about Craft or similar and General laborers, since a male had 24 percent and 2 percent, whilst the opposite sex had only 3 percent and 1 percent respectively.
When it comes to males in 1992, specifically, Managerial and Professional, they possessed 36 percent, whereas this value is higher than a woman's one for 7 percent. Clerical or related had another story, the opposite gender of male experienced 31 percent, but the male had only 6 percent. Other manual had the same story, women were recorded 27%, and this is 1 percent higher than a male's one. Both genders which are female and male, stood at 9 percent and 6 percent, when it comes Other non-manual. Male totally vanquished females if the story was about Craft or similar and General laborers, since a male had 24 percent and 2 percent, whilst the opposite sex had only 3 percent and 1 percent respectively.

IELTS_Writing_Task_1.png
