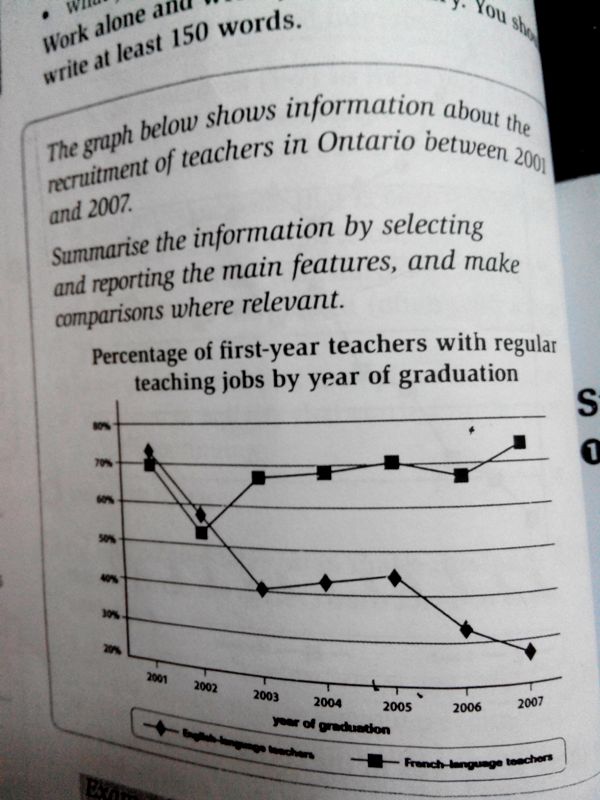
The line graph illustrates the percentage of English and French teachers who apply to teach regularly in Ontario over a six-year period. Overall, at the beginning of the period, it can be seen that while both of the language teachers stood the same level at around 70%, French teachers had a stable change and greater than other which hit a low in the end of the time frame.
According to the data, in 2002 French teachers reached a trough of approximately 50% and rose steadily to almost 70% in the following next year. However, English teachers significantly decreased to 40% from 2001 to 2003. Then, both of them showed the different trend in the last four-year period.
In 2005, A gradual increase of 70% was revealed by persons-in-charge in French, and it rose slowly again more than 70% in 2007. In contrast, the other dropped to the lowest level less than 30% in the end of time whereas it had been slightly growing for two years at more than 40% between 2003 and 2005.

language_teacher.jpg
