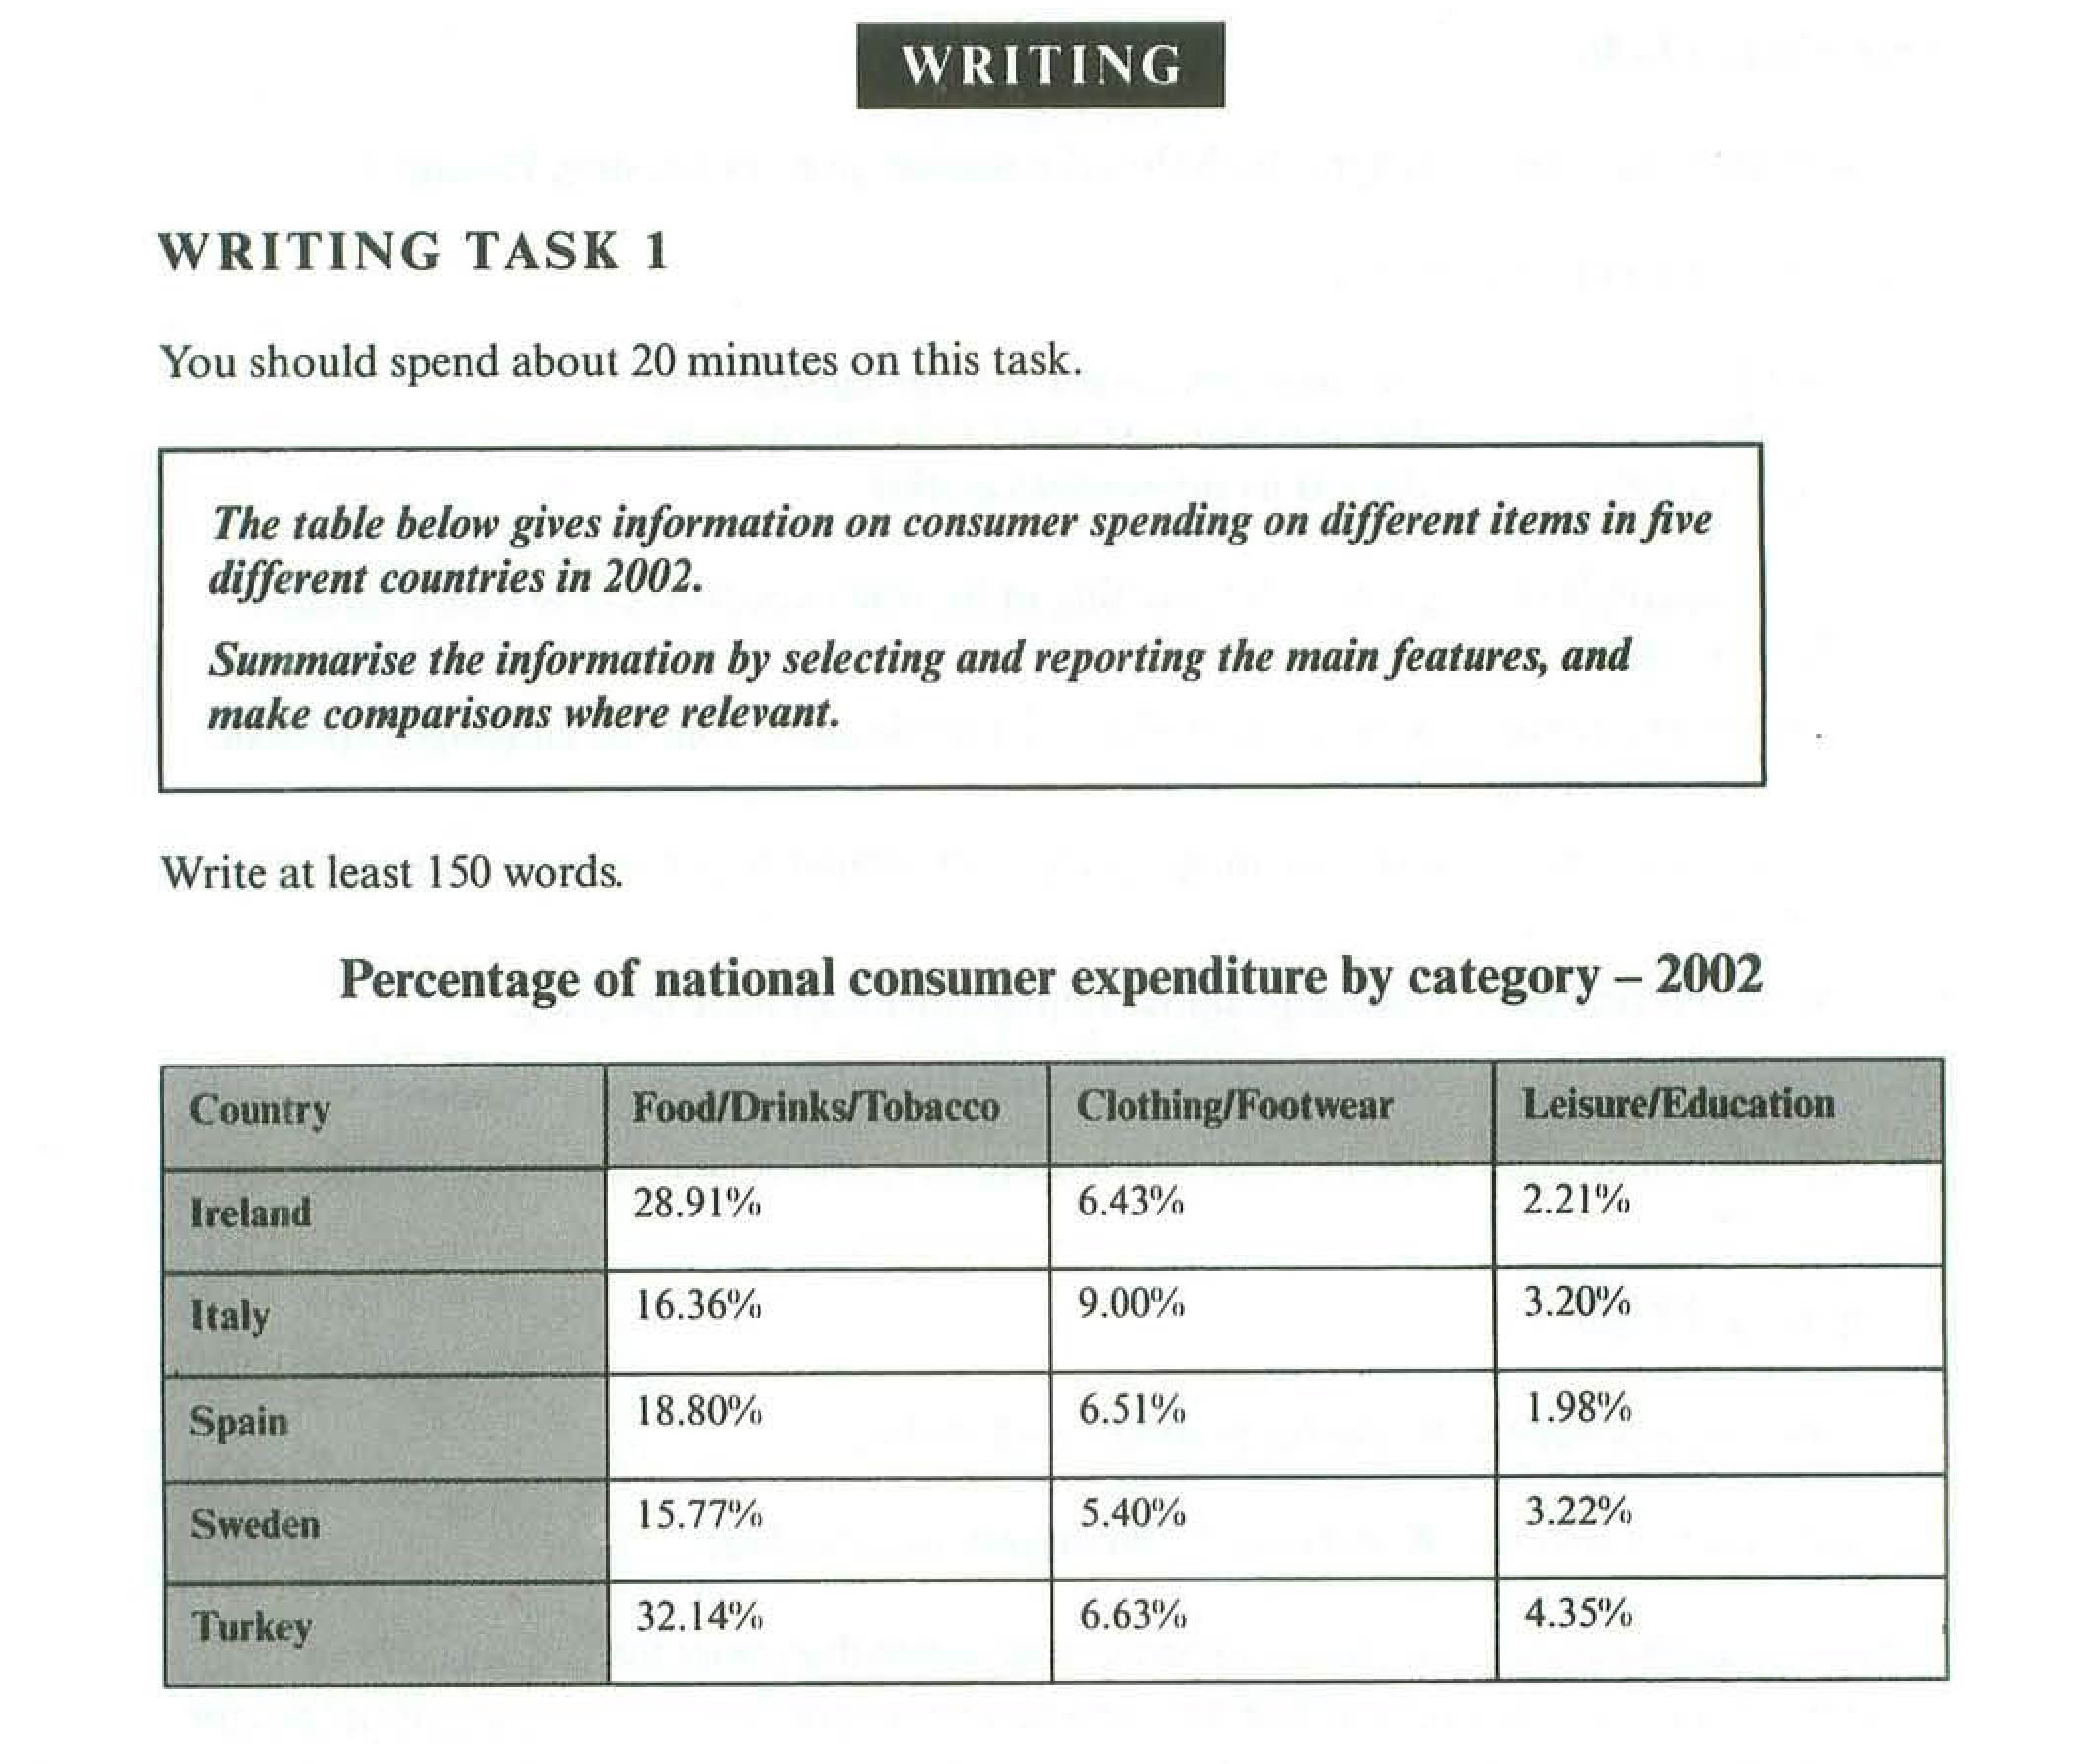
[IELTS] Task1: Table on consumer spending information in 5 countries on different items
This table illustrates the percentage of national consumer expenditure under three different categories, in the year of 2002. This data was taken from five countries, namely, Ireland, Italy, Spain, Sweden and Turkey.
All the five countries showed similar type of trend. In other words, everywhere, people spent more on food, drinks and tobacco; the least spent category was leisure and education; clothing/footwear category was in between the other two. In all the countries, food, drink and tobacco were in the highest position on total consumer spending. In Ireland and Turkey that were near 30%, whereas in other countries, the expenditure on food, drink and tobacco were below 20%.
Nine percentage of total expenditure was spent on clothing/footwear by Italian consumers. However, in other four nations the values were around six percentage. Comparatively, Turkish consumer expenditure on leisure/education was a larger value (4.35%), and in Italy and Sweden the values were around 3.2%; in the other nations the percentages were lower.
Overall, in 2002, the most and least spent categories were food/tobacco and leisure/education respectively in all five nations.

Task-1
