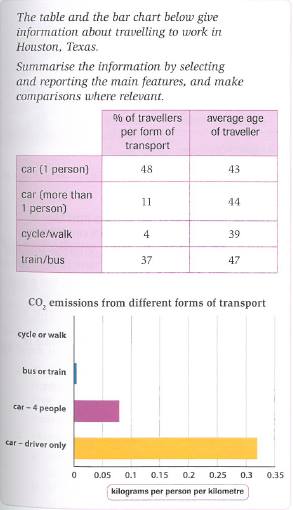
The table chart reveals the percentage of vehicle that workers in Houston use to go to work and the average age of users of four different vehicles. The bar chart shows the number of CO2 emissions that the vehicles produced during the working activity. Overall, it can be seen that people aged 47 years old prefer travelling to work by train or bus. The highest percentage of vehicles that workers use is a single passenger car, and also the same type of vehicle becomes the greatest number of CO2 emissions producers.
The most favorite conveyance for employees in Houston, Texas is car with driver only. The percentage of this vehicle is 48% and followed by train or bus at 37%. The third is car also, but with more than one passengers at 11%, and the last is bicycle at 4%. The average age of labor that use bicycle as the means of transportation is 39 years, followed by one person in the car at 43 years, the next is more than one person in the car at 44 years, and people aged 47 more likely to use bus or train.
In the Houston, Texas, the workers more likely to use a single passenger car, in contrast to the effect to the environment, it gives more than 0.3 kilograms each person per kilometer. The car with more than one passengers becomes the second largest producers of CO2 emissions approximately 0.08 kilograms per person each kilometer. Bus or train becomes the third with no more than 0.01 kilograms per person per kilometer. The most healthies conveyance is the bicycle with zero CO2 emissions.

12115973_11455715388.jpg
