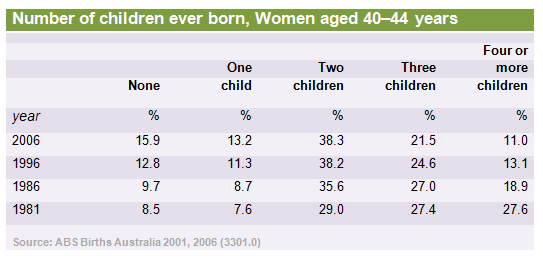
The table illustrates the number of children born to 40-44 years old women in Australia for four different years (1981, 1986, 1996 and 2006). It can be seen from the table that the first three categories had an increasing from the first period to the last period. While, three children and four or more children categories experienced a reduction from the first period to the last period.
In 1981, the highest proportion of women in the age group was which has two children at 29% and then experienced significantly increasing until the end period at 38.3%. None and two children categories also followed this trend, having its increasing from 8.5% in 1981 to 15.9% in 2006 and from 7.6% in 1981 to 13.2% in 2006 respectively.
Both of three children and four or more children categories experienced a reduction in its proportion. Women who has three children was 27.4% in 1981 and then dropped down gradually to 21.5% in 2006. While, women who has four or more children reduced significantly from 27,6% in the first period to just 11% in the last period.

Academic_IELTS_Writi.png
