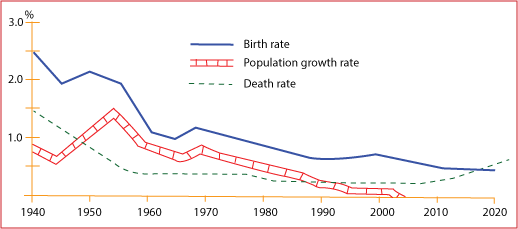
The line figure illustrates three kinds of demographic trends (birth rate,population growth rate and death rate) in Scotland over 80 years from 1940 to 2020.
Overall,the birth rate and the population growth rate declined over the period given,while the death rate rose.At the beginning of the period,the birth rate was the highest rate,which was replaced by the death rate in 1997.
The birth rate and the population growth rate began at around 2.5% and almost 1.0% respectively.Both rates declined until the middle of 1940 and then increased gradually.By contrast,the death rate dropped significantly from nearly 1.5% to just under 0.5% between 1940 and 1950.
After1950,the birth rate decreased steadily to approximately 0.5% in 2020,while the figure for the death rate went up slightly to above 0.5% in the same year.The population growth rate finally fell to 0% after reaching a peak at around 1.5% in the middle of 1950.

Demographic_Trends_S.png
