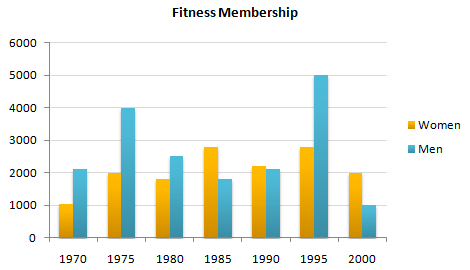
The bar chart depicts about number of women and men who as fitness membership for three decades since 1970 till 2000.
Overall, Bar chart fluctuates every five years but female members chart is slightly more stable in point between 1000 and approximately three thousand users. However amount of male fitness member is higher in four years.
Beginning from 1970, there was more than 2000 men join as fitness members. Rising double marked five years later. While two periods next to it fell under 2000 people, it rose again touching the highest number, 5000 men listed as fitness membership. Unfortunately it declined significantly as 80% in last chart.
The women membership moved up and down in every points. Two highest numbers of women membership happened in 1985 and 1995 nearly 3000 females. Also the lowest point was in 1970 with a thousand members but after that the members never always more than 1700 female members. Interestingly, both of female and male fitness membership had the same lowest sum with a thousand members.

Fitness_memebership..png
