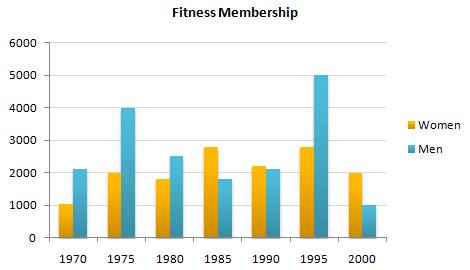
The bar chart describes a group of people who registered in fitness place within 1970 up to 2000. Overall, the male group reached the highest level in 1995, but 5 years later it dropped sharply, compare with female group which had a steady flow within 30 years.
The male groups went through ups and downs more often and sharply than female groups which had a fluctuated flow. The male group's peaked at 1995 which the membership accumulation showed there were 5000 people in the year. While the prior top level of male group arrived only 4000 people in last 2 decades. Yet, after the highest level in 1995 it decreased dramatically four-fifths than the total membership in 1995.
Meanwhile, the female group spanned the numerous membership in 1985 and 1995 by almost 3000 membership known, while they reached a through of the year of 1970 when the calculation of membership showed no more 1000 people at the stood point.

writing_task_2.jpg
