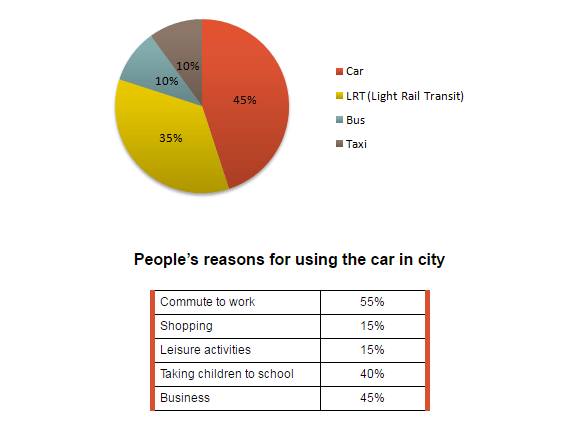
The diagrams of transport and car use in Edmonton.
The pie chart compares the utilizing of four different vehicles and the given table illustrates several reasons of people who traveling through car in Edmonton city. Overall, it can be seen that the figure for using car was by far the greatest of transport utilization. What is more? Most of people go on trip by using car is due to work commute.
A closer look at the data reveals that the proportion of car utilization is more than two fifths. While using Light Rail Transit (LRT) at 35%, is the second more popular transport in the city, the remaining of two groups, both bus and taxi shows a minority, at 10% of whole proportion.
A large number of people prefer car going to the other places because of work commute. There is two-fifths of inhabitants using car for taking their children to school while more than it, at 45% due to business traveling. However, the figure for shopping and leisure activities seen the least proportion, at less than a fifth.

13177431_10204576023.jpg
