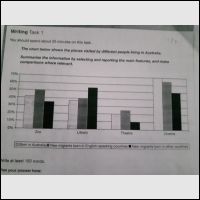
The bar chart illustrates four places (zoo, library, theatre and cinema) attended by three different individuals living in Australia. At first glance it can conclude that cinema was the most popular among the four, while theater is the least one.
Regarding to cinema, the most visitors were natives which the percentage was up to 70%. This was followed by new migrants from English -speaking countries' at the second place, and the other countries' new migrants at the third. In contrast, theatre absorbed the lowest number of visitors which was only about a third of cinema's visitors in total.
Turning to zoo and library, the new migrants from other countries reached the highest percentage in attending library, while they stood at last in visiting zoo. Then, the new migrants born in English-speaking countries and the natives came respectively in visiting both zoo and library. Moreover, the interesting point of this chart is the contrast trend showed by the percentage of library and cinema, while the figure in zoo and theater showed the same pattern.

bar.jpg
