Unanswered [0]
  

Home / Writing Feedback   % width   Posts: 3


The gender distribution of Australians doing regular physical activities in 2010


hoangtubongdem 1 / -  
Sep 27, 2022   #1

Cambridge 12 Writing Test 1 Task 1 - Physical activities


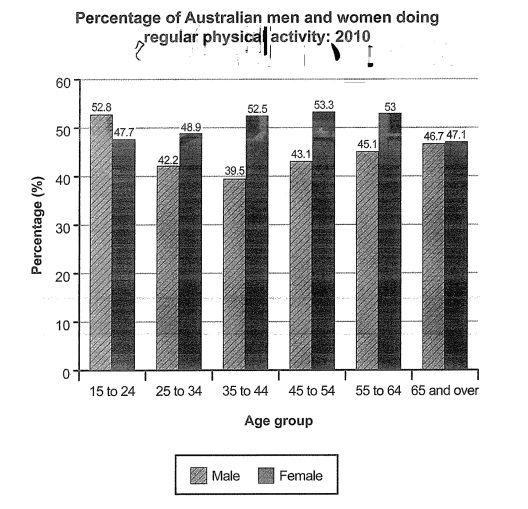
The bar chart below shows the percentage of Australian men and women in different age groups who did regular physical activity in 2010. Summarize the information by selecting and reporting the main features, and make comparisons where relevant.

My essay
The bar chart depicts the gender distribution of six different Australian age groups in 2010 for doing regular physical activity. Overall, it is clear that except the 15-to-24-year-olds, all the remaining groups played the same role, which is the women's figures were higher than the men's one. Not only that, three groups aged from 35 to 64 had the highest proportion.

Looking at the graph more closely, one can be seen that the percentage of males in the youngest group was higher than the female, which was 52,8 percent and 47,7 percent respectively. The middle groups aged between 35 and 64 shared the same figures of women did regular physical activity that fluctuated in 53 percent. The men were 39,5 percent, 43,1 percent and 45,1 percent proportionately aged 35 to 44, 45 to 54 and 55 to 64. While the 25 to 34 age group had a markedly disparate proportion, the oldest ones had equal numbers. It was 42,2 and 48,9 percent for male and female figures in the younger age group and 46,7 and 47,1 for the elderly people.

(185 words i guess ? (i use word to calculate)
Please help me review my essay. I will take the exam next November and my aim for Writing is 5.5-6.

  • cam12test1task1.png


Holt  Educational Consultant - / 15461  
Sep 28, 2022   #2
Even though the word count was more than met with the writing, the incorrect format and missing reporting elements are what will hold back the score for this essay. The writer must make sure to meet not only the word count, but all of the required scoring elements to achieve his target score next time.

Several problems can be seen in the summary overview. The first problem, is that the writer did not enumerate the age groups as a part of the notable information and yet, he quotes 2 of the 6 age divisions in the trending statement. That creates a disconnection in the summary presentation. His high and low statement should not refer to an in-between measurement either. That is irrelevant to the trending consideration. A better summary score can also be achieved if he uses specifics to identify the image type. For example, there are 2 types of bar charts: vertical and horizontal. By identifying the position of the bar graph, a more accurate mental reference can be created in the mind of the reader.

The reporting paragraph is too compressed. This makes it difficult to follow and creates difficulty in separating the reporting information. For this type of 1 image reference, the writer should always use the 3 paragraph format:

Summary overview + trending statement
Reporting paragraph
Analytical / comparative paragraph

This is not a bad start. At least the writer shows enough of an English vocabulary to meet the word count. Now, if he can focus on the correct format and reporting requirements, he should achieve his passing score in the next practice essay.
Hoang Minh 4 / 8  
Sep 28, 2022   #3
I think your should do your Overview more clearly. Well, I mean that in an Overview, people usually overview main point what they are going to write. If you are going to write 2 paragraphs in the body, it is suggested that you should write the Overview so that it can contain the main point of each paragraph in a short way.


Home / Writing Feedback / The gender distribution of Australians doing regular physical activities in 2010
ⓘ Need Writing or Editing Help?
Fill out one of these forms for professional help:

Best Writing Service:
CustomPapers form ◳

Graduate Writing / Editing:
GraduateWriter form ◳

Excellence in Editing:
Rose Editing ◳

AI-Paper Rewriting:
Robot Rewrite ◳