SHOP CLOSURES AND OPENINGS
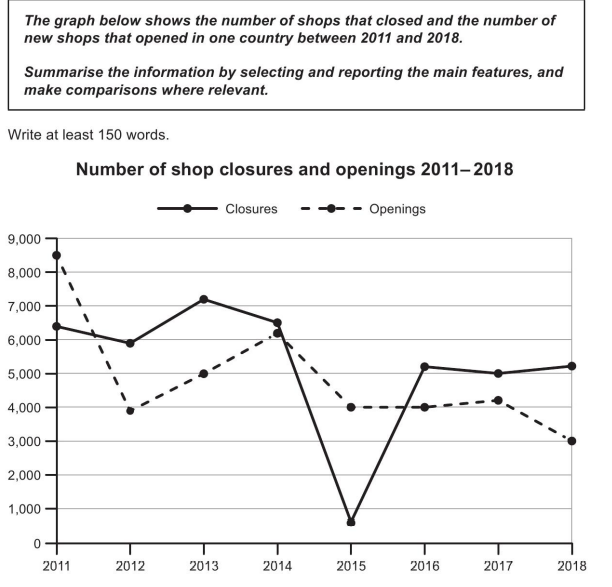
The given diagram demonstrates the figure for shops closing and opening from 2011 to 2018.
At first glance, we can see that both these two quantities wildly fluctuated before that for shop closures exceeded new shop openings' in 2016.
According to the graph, the number of shops that faltered hovered around the mark of 6,000 between 2011 and 2014, then reached a low of under 1,000 in 2015. Likewise, the figure for shop openings suffered a period of instability, plummeting by more than 4,000 in 2012 and making a recovery to approximately 6,000 in 2014. From 2011 to 2015, these quantities registered constant changes as one figure overtook the other and vice versa.
However, in 2016, the number of shops closing rose to roughly 5,200, correspondingly with that for shop openings stabilizing at 4,000. This situation is projected to remain the case, as the quantity of shop that closed enjoyed a period of stability while that for new shop openings slightly dropped by 1,000 in 2018.

screenshot_167619890.png
