car ownership in the UK
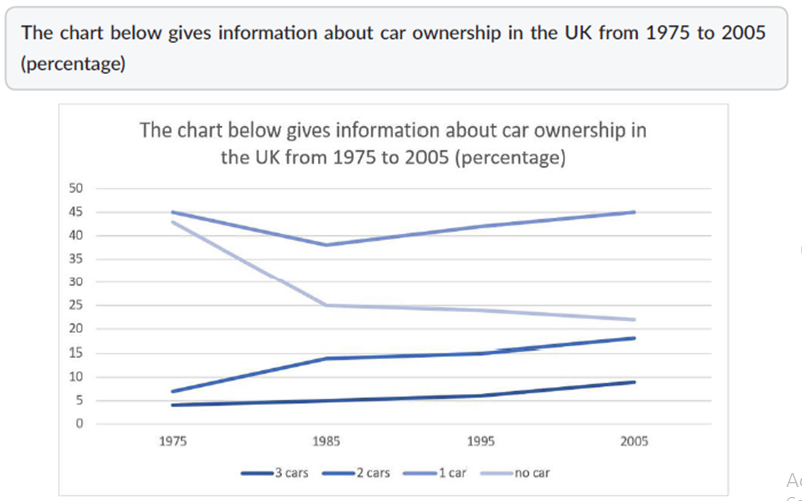
The given line chart provides data about car ownership in UK between 1975 and 2005. Overall, the proportion of people who owned two or three cars increased while the percentage of whom have no car declined. Concurrently, the figure for owners with just one car occupied most during the period.
Starting at 4% and 7% in 1975, the respective proportion of owners who have two and three cars jumped up to just over 5% and over 15% in 1985. By contrast, the figure for people who owned one or no car constituted most at nearly 45% in 1975. However, the rate of people who had no car dropped significantly to 25% and the rate of people with one car fell to 37%, hit the lowest point in 1985.
From 1985 to 2005, the figure for whom had two or three cars climbed up gradually to roughly 18% and 10%, respectively. At the same time, the percentage of people who owned no car continued to decline slightly to approximately 22% whereas the proportion of those with one car steadily rose up to over 45%, account for the highest percentage of car ownership in UK.

Screenshot2023072.png
