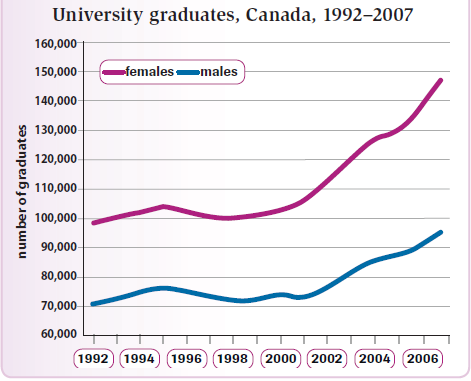
The given line chart provides the quantity of graduated students in universities of Canada in the period between 1992 and 2007 according to sexes. Overall, it is really important to notice that although both of sexes had simillar pattern which saw an upward trend, females were the higher number than males .
In 1992, both woman and man graduated proportion stood at 100 thousand and 70 thousand respectively; then, both were followed by a downward trend in 1995. Afterwards, there had been a slight decrease in both by 1997. Between 1997 and 2001 female graduate proportion fluctuated slightly around 100 thousand compared to male proportion at approximately 75 thousand.
In the following year, female figure showed a sharp rise in number of graduates by a half of the former and reached a peak at just below 150 thousand graduates. In contrast, by the same period, the quantity of male graduates had increased slightly by 25 thousand and had finished at about 95 thousand.
(163 words)

graduates in Canada
