Unanswered [1] | Urgent [0]
  

Home / Writing Feedback   % width   Posts: 2


Given are the pie charts comparing two sexes in terms of the proportion of occupations in the UK


papcaii 4 / 7  
Sep 23, 2021   #1

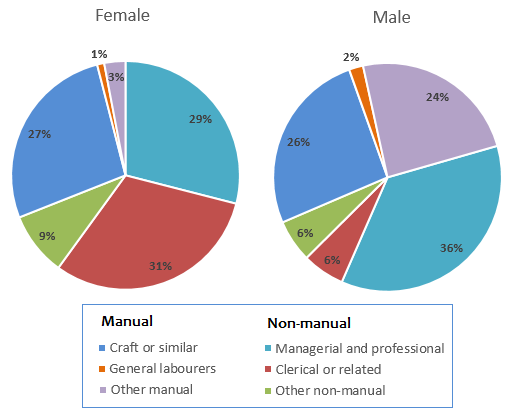
Employment patterns in great britain in 1992


The two pie chart below show some employment patterns in great britain in 1992

Given are the pie charts comparing two sexes in terms of the proportion of occupations in the UK in the year 1992.
Overall, the majority of British women preferred non-manual jobs, while the figure for men was marginally fewer. It is also evident that clerical works were widely prevalent among the women, on the contrary, men were not interested in this form of jobs.

As can be seen in the graphs, the rate of managerial and professional employment was highest in both 2 genders, 29% for women and 36% for men respectively; conversely, that of general labourers works were relatively negligible in the studied year.

Regarding the percentage of clerical and related occupations in 1992, men overnumbered women in the ratio of 5 to 1 (nearly a third and 6%, respectively). In contrast, the opposite trend was true in the other manual jobs. Meanwhile, the proportions of craft among 2 sexes were the same, which stood at somewhere in the vicinity of a quarter.

Thanks for your help !

  • graph287employment.png


Holt  Educational Consultant - / 15372  
Sep 25, 2021   #2
pie charts comparing two sexes

Clarify that the pie charts for each gender is seperate. This confusing reference to the number of pie shouts is precisely why the image number must be mentioned in the first sentence along with the image type.

proportion of occupations

What are the occupations? The rundown would help add to the reference in the trending statement.

[quote=papcaii]It is also evident that clerical works were widely prevalent among the women, on the contrary, men were not interested in this form of jobs.[/quote]

One trend will suffice. In cases where there is a possibility of 2 trends, pick the strongest one and save the weaker reference for the reporting paragraph.

The writer has forgotten to reference the actual measurements in relation to several mentions. Where a measurement value is present in the image, it must be reported in the paragraph presentation.


Home / Writing Feedback / Given are the pie charts comparing two sexes in terms of the proportion of occupations in the UK
Do You Need
Academic Writing
or Editing Help?
Fill out one of these forms:

Graduate Writing / Editing:
GraduateWriter form ◳

Best Essay Service:
CustomPapers form ◳

Excellence in Editing:
Rose Editing ◳

AI-Paper Rewriting:
Robot Rewrite ◳

Academic AI Writer:
Custom AI Writer ◳