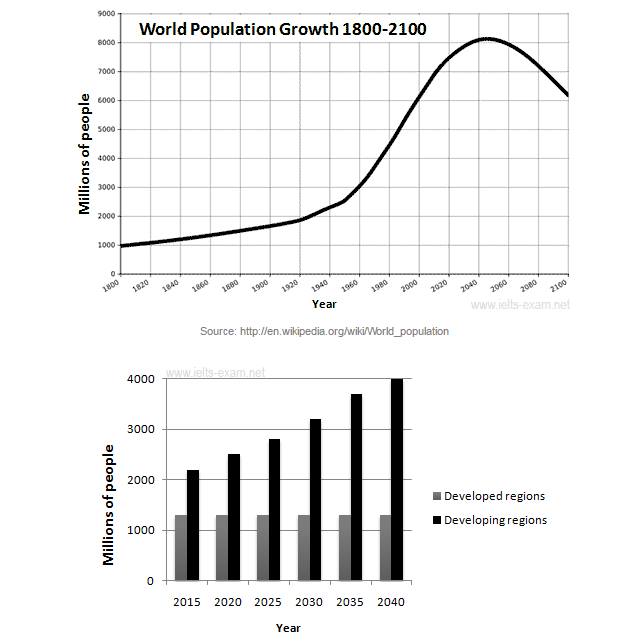
The graphs below provide information on global population figures and figures for urban populations in different world regions.
Summarise the information by selecting and reporting the main features, and make comparisons where relevant.
The line chart shows the information of demography in overseas, and is measured in number of people and the bart chart illustrates the populations in city of rich countries and poor countries, in the world and is measured in number of people. Overall, the world population increse steadily whereas in three years last decrease. It can also be seen that the poppulation in developing country rise gradually.
In 1800, the number of people world population growth stood at 2000. The number inceased gradually to 2500 in 1940. However, there was a significant rise in the number of people to 6000 number in 2000. Next, it is predicted to incease significantly to 8000 in 2040, which is the peak of demography growth, but then fall dramatically by 6000 over the period.
The population in city of developing regions higher than the developed countries, and the number of people in poor regions at approximately 2200, then it is expected to rise gradually over a 25-year period. However, the population in developed at 1300 countries in 2015, but, it is predicted wiil remain over the period.

Population.jpg
