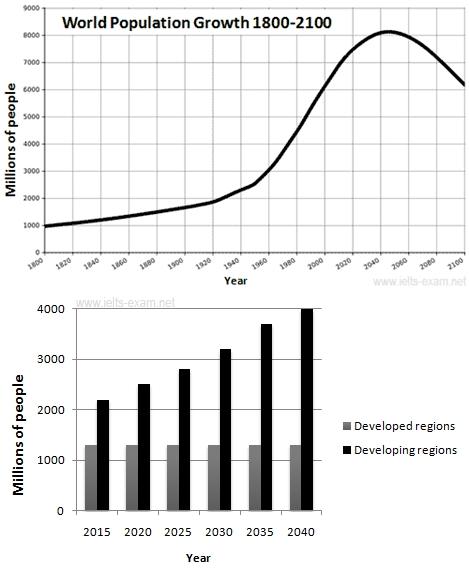
The graphs below provide information on global population figures and figures for urban populations in different world regions.
The line graph and bars-chart give information about global population rates and the average number of urban population in different world areas. Overall, the global population would continue to rise gradually until over around four decades and the majority of the people would be living in developing countries, while the people lived in the developed countries indicated will be stable as the previous periods-situation.
According to the given data, the number of people in the world stood at 1 billion in the first period, 1800. Then, there is a gradual increase of population from the first period to almost one and a half century and then rise sharply reaching the top point approximately 8 billion after a century. After over a half century, the trend experiences a sharp decline until reaching 6 billion points.
Furthermore, developing countries has a huge number of rate population globally, while develop countries are stable during 35 years. A population number of developing countries increased gradually over three decades, from 2015 to 2040. (169 words)

global_population_fi.jpg
