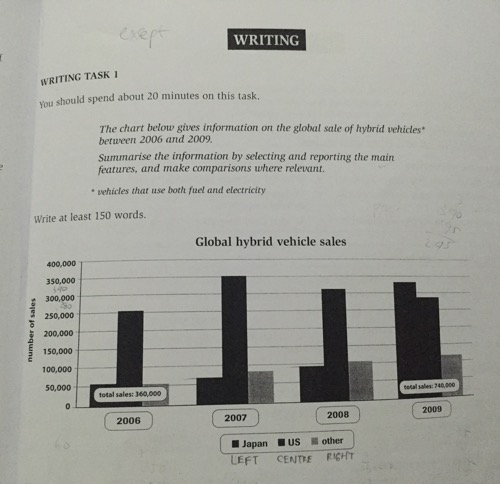
The bar chart illustrates information about the global sale of fuel and electricity-based vehicles -hybrid vehicles- by taking Japan, US and other countries as the objects of observation. In which, this chart provides the information between 2006 and 2009. Overall, it can be obviously seen that US' global sale was always the highest among two other countries, except in 2009.
A closer look at the chart reveals that three preceding years witnessed US as the highest global rate with the average roughly at 300,000. However, in the last period, by having a gap by 60,000 more, Japan successfully beat US' global rate and became the highest. The development of Japan's global rate can be said that it was very surprising since it had an average at 70,000 from 2006 to 2008, but in 2009, there was an extremely sharp rise, at around 340,000 -having a difference by 245,000 with the previous year. While Japan showed an immense development, the other seems did not have a dramatical growth in its hybrid vehicles' global rate, where 2006 saw the fairly similar state with Japan, at approximately 55,000. Then, it continuously increased regularly in each year and finally reached 110,000 in 2009.
A closer look at the chart reveals that three preceding years witnessed US as the highest global rate with the average roughly at 300,000. However, in the last period, by having a gap by 60,000 more, Japan successfully beat US' global rate and became the highest. The development of Japan's global rate can be said that it was very surprising since it had an average at 70,000 from 2006 to 2008, but in 2009, there was an extremely sharp rise, at around 340,000 -having a difference by 245,000 with the previous year. While Japan showed an immense development, the other seems did not have a dramatical growth in its hybrid vehicles' global rate, where 2006 saw the fairly similar state with Japan, at approximately 55,000. Then, it continuously increased regularly in each year and finally reached 110,000 in 2009.

IMG_5032.JPG
