Hi Guys
I wrote this writing task 1 for ielts
I would appreciate any comment or suggestion and it will bw great if anyone give me an approximate band score
thanks a lot
Q: Write a report for a university lecturer describing the information in the
graph below.
You should write at least 150 words.
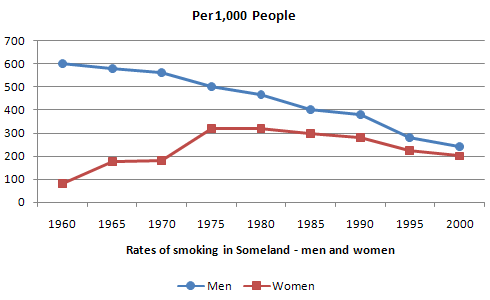
The graph shows the pattern of smoking of different sexes in Someland during 1960 -2000. As an overall pattern the graph give us the information that the number smoker men started to decline during this period of the time, while the number of women smokers had a rise until 1975 then started an slightly fall to the end of this time. Moreover, the number of male smoking was always more than women during this period of the time.
A holistic view on men's smoking numbers shows that the number of male smoker has slightly dropped during the time from 600 per 1000 person by almost 350 during 40 years. This decline shows that smoking lost its popularity among the men during the time.
However, women show another trend regarding the numbers of smokers at this period. Female smokers, which account less than 100 smokers per 1000 person at the beginning of this period, have two jumps during the time. The first one is from 1960 when female smoker have risen of 200 in 1965 and stayed levelled off for 5 years. The second increase was from 1970 to 1975 when they reached to over 300 smokers per 1000 person. Since 1975 the number of women smoking have a steady dropped until year 2000 when the number reached to around 200 smokers per 1000 person.

graph 1
