Unanswered [1]
  

Home / Writing Feedback   % width   Posts: 7


Graph: Different levels of education in developing and developed nations.


joythblessy 86 / 266  
Feb 8, 2013   #1
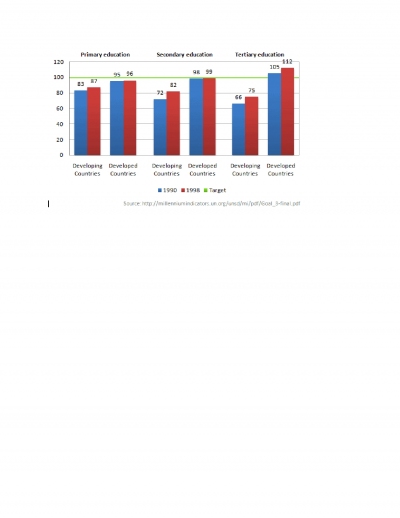
68 The chart below shows the number of girls per 100 boys enrolled in different levels of school education.

Write a short report for a university lecturer describing the information shown below.
You should write at least 150 words.

The given bar chart illustrates the number of girls per 100 boys enrolled in different levels of school education. This data is comparing the difference between developing and developed countries in the years 1990 and 1998 with the target of 100.

In cause of primary education, there was not much difference between the developing nations in 1990 and1998 and was below the target. In the same period, the developed countries also the number was roughly same, very close to the target.

At the same time, in case of secondary school education, developed nations roughly reached the target in 1990 and 1998 and both was around same. Developing nations, though they improved the number of girls in 1998they didn't came near to the target.

All nations showed improvements in the number of girls in the year 1998 compared to 1990. Developing nations never catch the target in 1990 or 1998, while developed came very close to the target and attain it in territory education.
dumi 1 / 6793  
Feb 8, 2013   #2
Hi Tessy,
Why don't you upload your graph? It's easy for others to comment when they see the graph :)

This data is comparingcompares the difference between developing and developed countries in the years 1990 and 1998 with the target of 100.

.... it's good to keep tense in simple present for this type of report writing

In cause of primary education, there was not much difference between the developing nations in during 1990 and 1998 and was below the target.

.... there is some issue with this line, but I cannot really comment without having access to your graph... Anyway I feel the latter part should be taken into a new sentence.

. In the same period, the developed countries also the number was roughly same, very close to the target.

what you've written has a grammar issue;
During the same period, the developed countries too had similar trend and statistics just reached the targeted figures.
I guess I provided you with reasonable comments without seeing the graphs :) Try to upload them so that I can have another look :)
devabe2005 46 / 96  
Feb 8, 2013   #3
didn't came near to the target. --> i think instead of "came" you can use "reach" --> didn't reach near to the target.
OP joythblessy 86 / 266  
Feb 8, 2013   #4
Hai dumi..

i am trying to convert my graphs ...(.

this was a failed attempt...(.

along with this i tried to post the graph...

sorry for the inconvenience...(.

This is the graph...which i was unable to upload...);

THANKS FOR THE CORRECTION

Tessy


  • G68compress.jpg
dumi 1 / 6793  
Feb 8, 2013   #5
Alright... now it makes sense :)

The given bar chart illustrates the number of girls per 100 boys enrolled indifferent levels of school education.

You are submitting a report .... so specify what those levels are.... they are your observations. Also include an overall picture of the graph in your introductory statement;

The bar charts illustrate the number of girls per 100 boys enrolled in the three levels of school education such as primary, secondary and tertiary levels in both developing and developed countries in the years of 1990 and 1998.

This data is comparing the difference between developing and developed countries in the years 1990 and 1998 with the target of 100.

The target line is set for 100 girls for both underdeveloped and developed countries for the years of 1990 and 1998.

In causecase of primary education, there was not much difference between the developing nations in 1990 and1998 and was below the target.

In case of primary education for both 1990 and 1998, there is no clear difference of the number of girls enrolled with schools in both developing and developed nations. However, according to these statistics the actual number of girls enrolled with schools lie below the target for the years under review.
OP joythblessy 86 / 266  
Feb 8, 2013   #6
Hai Dumi..

Thanks for the correction..

I have onr doubt..
The graphs which shows the past years like 1999, 2007 comparissons we should was past tense or we can write it as simple present tense...?

Thanks..
dumi 1 / 6793  
Feb 9, 2013   #7
Well, I think it depends on the situation. You can combine tenses as well. Also I advise you to use passive forms more often in report writing to avoid this confusion at times. Let's take a few examples from this one itself;

It can be observed that the developed countries have reached the target levels for the numbers of girls enrolling with secondary schools in both 1990 and 1998.

[i]The bar charts illustrate that the developing countries have fallen significantly low in the statistics of girls enrolled with tertiary education institutes compared to the developed countries.[/i... here I have mixed all tenses :)


Home / Writing Feedback / Graph: Different levels of education in developing and developed nations.
ⓘ Need Writing or Editing Help?
Fill out one of these forms for professional help:

Best Writing Service:
CustomPapers form ◳

Graduate Writing / Editing:
GraduateWriter form ◳

Excellence in Editing:
Rose Editing ◳

AI-Paper Rewriting:
Robot Rewrite ◳