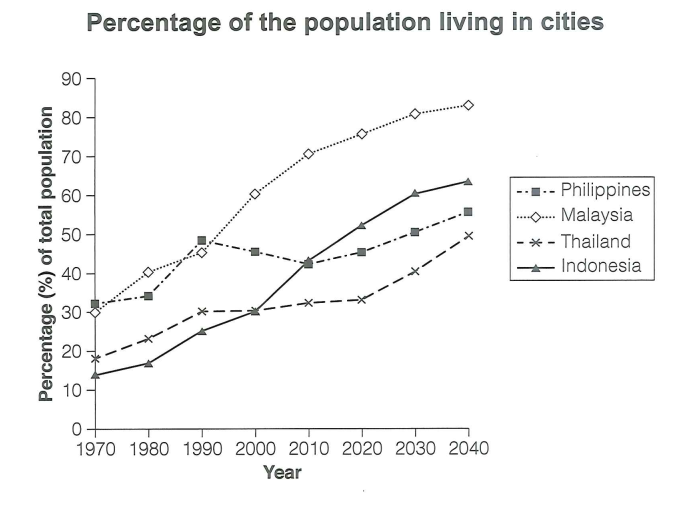
the proportion of city inhabitants in four countries over a period of 70 years
The line graph illustrates the proportion of city inhabitants in four countries over a period of 70 years starting from 1970, including expectations for 2030 and 2040.
It is obvious that while the numbers of urbanites in Malaysia, Thailand, and Indonesia all made an ascension and will continue to rise from 2030 to 2040, the figure for those in Philippines slightly fluctuated but will increase eventually according to the projections. Additionally, while Malaysia had the most city dwellers for most of the period, the opposite was true for Thailand.
In 1970, both the proportion of city inhabitants in Malaysia and that in Philippines were almost identical, at around 30%. However, over the following 50 years, there was a significant change in the trends of these two. The figure for urbanites in Philippines experienced a period of fluctuation at around 30% to nearly 50% and reached its zenith in 1990, followed by a drop to 45% in 2010. Meanwhile, the figure for urbanites in Malaysia constantly rose, up to 75% in 2020, and showed no signs of stopping. Despite the change between their trends, both the percentage of city inhabitants in Malaysia and that in Philippines are expected to increase, respectively up to approximately 85% and 50%.
Regarding the rest, Indonesia's cities were the least populated in 1970 of only 15%, while the Thailand one was slightly more. Over the next 30 years, The proportion of city inhabitants in both Indonesia and Thailand saw upward trends, then the figures meet at nearly 30% in 2000. In spite of that, some alterations happened between the trends. The number of people living in Indonesia's cities continued rising over the next 20 years while the figure for Thailand's city inhabitants stabilized in the mentioned period. Yet both of these figures will go up according to the predictions.

fds.PNG
