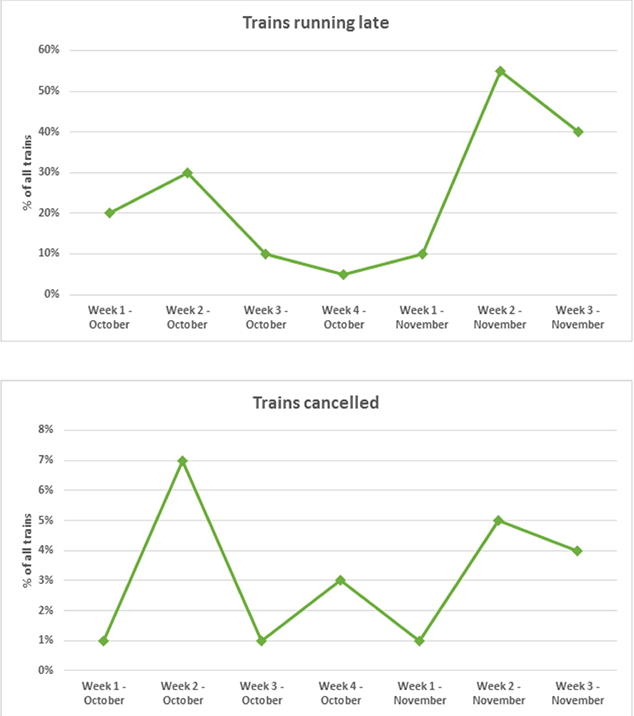
The provided line graphs illustrate the performance of a railway company in terms of trip cancellations and delays during October and November of 2008. Overall, both cancellation and delay percentages showed relatively similar fluctuations throughout the specified timeframe. Notably, October recorded the highest proportion of canceled trips, while November witnessed the peak in delayed trips.
In the initial week of October 2008, 20% of all trains faced delays, a figure that surged by 10% in the subsequent week, only to decrease to 5% by the month's end. Conversely, November started with over half of all trains running behind schedule, with a slight reduction to 40% in the third week.
Regarding cancellations, a mere 1% of all trains were affected in the first week of October. This percentage sharply rose to 7% in the following week, only to decrease by 1% subsequently. The remaining weeks saw cancellation percentages closely mirroring the pattern of delays, ranging from 1% in the first week of November to 4% in the third week.

ieltswritingrecent.png
