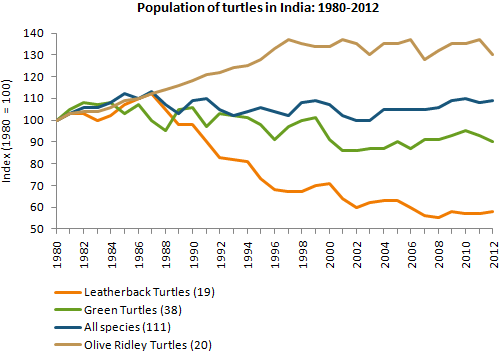
The given bar chart gives the information about the population of turtles in India between the years from 1980 to 2012, which include Leatherblack Turtles, green turtles, Olive Ridley and all species.
From the graph it is clear that, all categories of turtles were only 100 in 1980. It showed significant growth and falls during all these 22 yrs. All given categories of turtles population increased with marginal drop still 1984. Thereafter, up to 1999 all categories decreased except Olive Ridley. Green turtles had succeeded in maintaining their population between 90-100, while the population of all species stayed between 100-110 between the years 1998 to 2012.
Though, Olive Ridley turtles has shown a significant sharp growth in their population up to 1997, the following years it displayed a fluctuation in their population. It maintained the level of 130-120 from the years 1996 to 2012. On the contrary, Letherback turtles showed a continuous decrease with marginal increase and decrease, and reached the level of 60 in 1012 from 110 in the year 1987.
In short, all species and green turtles remain constant roughly over the period of last decade with minimal deviations. Latherback turtles has showed a downward trend in their population, while Olive Ridley turtles has increased the population and maintain the average population between the years 1996-2012.

graph
