Hello everybody. I am new member. I have started writing Ielts and I hope you can help me correct my report. Which band I can get in this task? Thanks a lot.
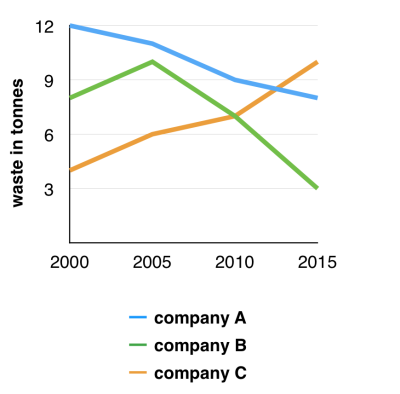
This is topic in task 1 ( from ielts-simon): The graph below shows the amount of waste produced by three companies over a period of 15 years.
The line graph illustrates the quantity of waste generated from three companies namely A, B, C from 2000 to 2015.
It is clear that both company A and B trended to reduce producing waste, while the amount of waste from company C nearly tripled over the time shown.
In 2000, company A produced the most waste, at 12 tonnes, followed by waste of company B and C with around 8 tonnes and about 6 tonnes respectively. There was a quick increase in the amount of waste of company B and C, at 10 tonnes and 6 tonnes in 2005. In contrast, the figure for company A went down approximately 11 tonnes.
The period from 2005 to 2015 witnessed a sharp rise in the amount of waste produced by company C, and the figure was highest, with nearly 10 tonnes in 2015. Whereas, company A and B reduced producing waste to about 8 tonnes and 3 tonnes respectively.
This is topic in task 1 ( from ielts-simon): The graph below shows the amount of waste produced by three companies over a period of 15 years.
Waste - the side product in an industry
The line graph illustrates the quantity of waste generated from three companies namely A, B, C from 2000 to 2015.
It is clear that both company A and B trended to reduce producing waste, while the amount of waste from company C nearly tripled over the time shown.
In 2000, company A produced the most waste, at 12 tonnes, followed by waste of company B and C with around 8 tonnes and about 6 tonnes respectively. There was a quick increase in the amount of waste of company B and C, at 10 tonnes and 6 tonnes in 2005. In contrast, the figure for company A went down approximately 11 tonnes.
The period from 2005 to 2015 witnessed a sharp rise in the amount of waste produced by company C, and the figure was highest, with nearly 10 tonnes in 2015. Whereas, company A and B reduced producing waste to about 8 tonnes and 3 tonnes respectively.

line graph
