Hi everyone, i will have an Ielts test in 26/10, can someone help me mark this passage like an ielts writing task 1 test.
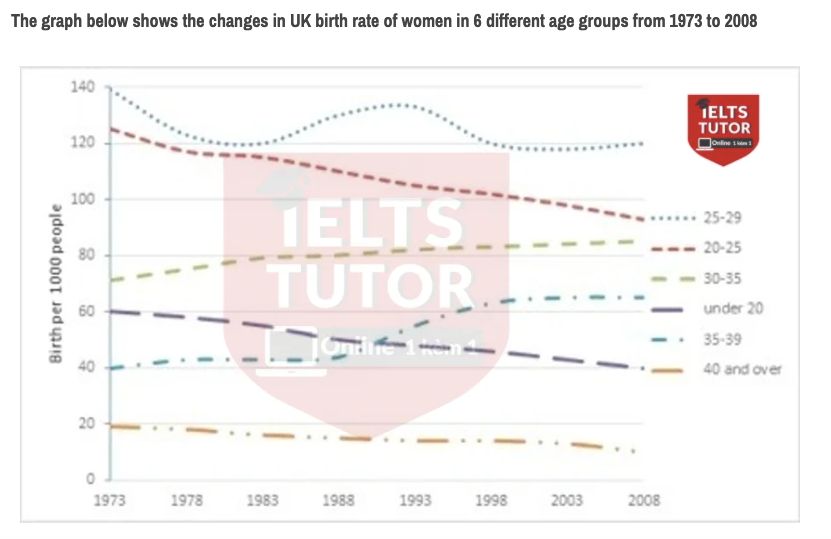
The graph below shows the changes in UK birth rate of women in 6 different age groups from 1973 to 2008
The provided graph illustrates the UK birth rates among women in 6 different age groups during a 35-year period starting from 1973.
Overall, it is clear that women aged 40 and above always had the lowest birth rate, while those aged from 25 to 29 maintained the highest. Additionally, there was a gradual decrease in birth rate among women who aged under 20.
Regarding figures, the birth rate of women aged from 25 to 29 fluctuated from 1973 to 2008, peaking at 140 per 1000 people in 1973 before dropping around 120 per 1000 people after 1998. Women aged from 20 to 25 remained the second highest UK birth rate group although there was a remarkable decline from above 120 per 1000 people in 1973 to about 90 per 1000 people in 2008. Moreover, the birth rate of women aged from 30 to 35 was always the third highest UK birth rate group, witnessing a slight rise from about 70 per 1000 people to above 80 per 1000 people.
The birth rate of women aged from 35 to 39 group showed a noticeable increase to above 60 per 1000 people in 2008. Additionally, the birth rate of the youngest group gradually decreased from 60 per 1000 people to 40 per 1000 people in 2008. In contrast, women aged 40 and older saw a slight decline in birth rate from 20 per 1000 to about 15 per 1000.

463780678_3798931457.jpg
