Unanswered [4] | Urgent [0]
  

Home / Writing Feedback   % width   Posts: 2


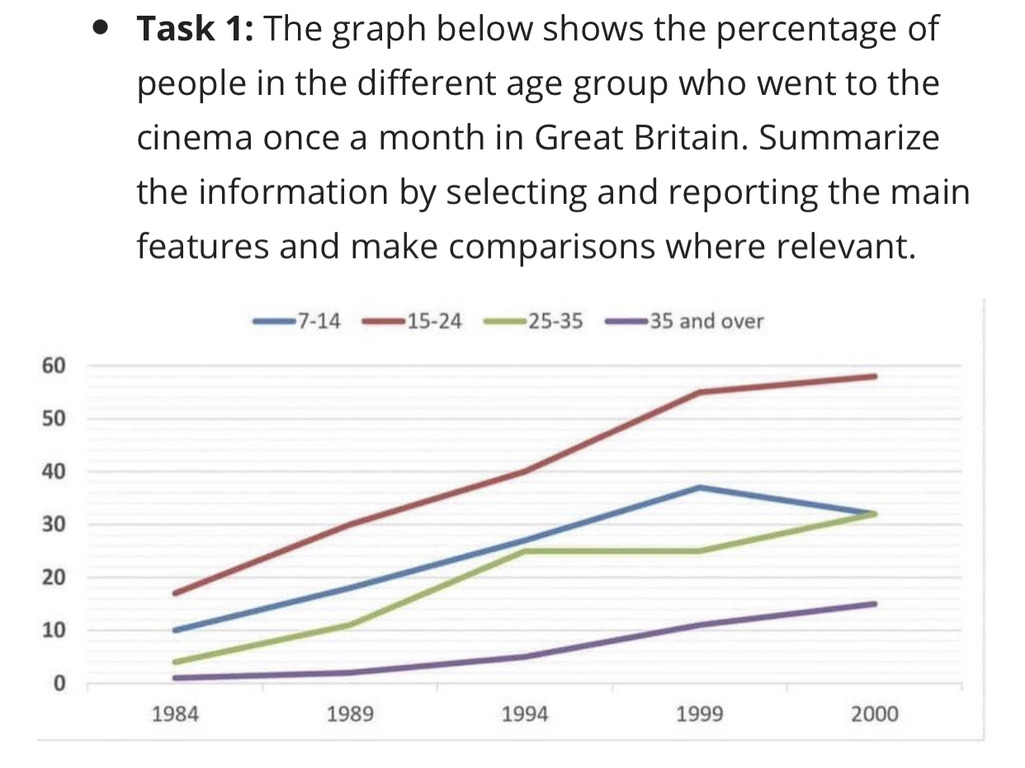
The graph below shows the percentage of people in the different age group who went to the cinema


Laelia 1 / -  
Sep 28, 2021   #1

uk data on attending cinema by age


The line chart compares the share of four age groups attending cinema once a month in Great Britain from 1984 to 2000.

Overall, apart from the 7-14-year-old group, three other ones experienced a vast escalation during the 17-year period. Additionally, people whose ages range between 15 and 24 took up the highest proportion, while the opposite was true for the middle-aged group.

Commencing at about 18% in 1984, a massive growth was seen in the percentage of 15-24-year-old individuals, reaching its highest peak of approximately 60% in 2000. Likewise, the figure for people who are 35 or older rose gradually, from roughly 0% to relatively 15%.

The 1984-2000 period witnessed a slight fluctuation in the data of adults aging 25-35, starting at about 5% then soared up by approximately 20% 10 years later, followed by a mild oscillation but rose to more than 30% in the last year. In contrast, the youngest age group experienced a record of 10% in the beginning, after which it climbed to its peak of around 38% yet fell to reach the same figure as the second-oldest one.

  • 2E10538D76FE4C10B.jpeg


Holt  Educational Consultant - / 15347  
Sep 29, 2021   #2
The writer has done the simplest reporting presentation. The report avoids a complete and accurate comparison analysis. This shortcut long sentence presentation did that. Without a properly presented individual idea sentence per paragraph, the coherence and cokeswereas of the presentation is lacking. There is no true simple and complex presentation either. So there are at least 2 points where the writer will recieve problematic scores. The writer must focus on developing written thought clarity through the proper structuring of sentences based on analytical reports. This essay is risked and focused on simple scoring considerations only. A more comprehensive piece of writing would better help the overall score. Use 3-5 sentences to meet this challenge.


Home / Writing Feedback / The graph below shows the percentage of people in the different age group who went to the cinema
Do You Need
Academic Writing
or Editing Help?
Need professional help with your assignments? Fill out one of these forms:

Graduate Writing / Editing:
GraduateWriter form ◳

Best Essay Service:
CustomPapers form ◳

Excellence in Editing:
Rose Editing ◳

AI-Paper Rewriting:
Robot Rewrite ◳