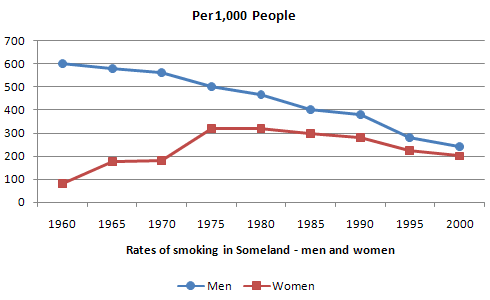
The graph below shows the rate of smoking per 1000 people in Someland from 1960 to 2000.
Summarize the information by selecting and reporting the main features and make comparisons where relevant.
The figure presented for analysis is a line graph. It illustrates the rates of smoking per thousand by sex, in Someland during 1960 to 2000. To better capture their distinctions, the period will be split into two phases - 1960-1975 and 1975-2000.
Overall, smoking rates for both genders converged around 200 per thousand. In 1960, much higher prevalence of smoking was found among males than females, over half versus below one in ten. Yet the disparity was rapidly narrowed, though never eliminated, over the course of next four decades when fewer men continued to light up but more women took it up.
At the beginning of phase one, 600 out of every 1000 men smoked, while less than 100 per 1000 women did so. The next 15 years saw a steady drop in male smoking rate, to 500 per 1000 in 1975. The prevalence of women who puffed, however, tended in the opposite direction, stepping up to its all-time high at marginally above 300 per 1000 when the phase ended.
Into phase two, men became more comparable to women in smoking rate, as male smokers shrank at more than double the rate female ones did. Female smoking rate held stable for 15 years before eventually sliding back to 200 per 1000 in 2000. But among males, the prevalence of smoking underwent a constant decline, to approximate 240 per 1000 in the same year.
I would more appreciate it if you score my essay. Now I challenge myself to pursue a 8.
Summarize the information by selecting and reporting the main features and make comparisons where relevant.
Percentage of smokers in Someland
The figure presented for analysis is a line graph. It illustrates the rates of smoking per thousand by sex, in Someland during 1960 to 2000. To better capture their distinctions, the period will be split into two phases - 1960-1975 and 1975-2000.
Overall, smoking rates for both genders converged around 200 per thousand. In 1960, much higher prevalence of smoking was found among males than females, over half versus below one in ten. Yet the disparity was rapidly narrowed, though never eliminated, over the course of next four decades when fewer men continued to light up but more women took it up.
At the beginning of phase one, 600 out of every 1000 men smoked, while less than 100 per 1000 women did so. The next 15 years saw a steady drop in male smoking rate, to 500 per 1000 in 1975. The prevalence of women who puffed, however, tended in the opposite direction, stepping up to its all-time high at marginally above 300 per 1000 when the phase ended.
Into phase two, men became more comparable to women in smoking rate, as male smokers shrank at more than double the rate female ones did. Female smoking rate held stable for 15 years before eventually sliding back to 200 per 1000 in 2000. But among males, the prevalence of smoking underwent a constant decline, to approximate 240 per 1000 in the same year.
I would more appreciate it if you score my essay. Now I challenge myself to pursue a 8.

QQez201708071929.png
