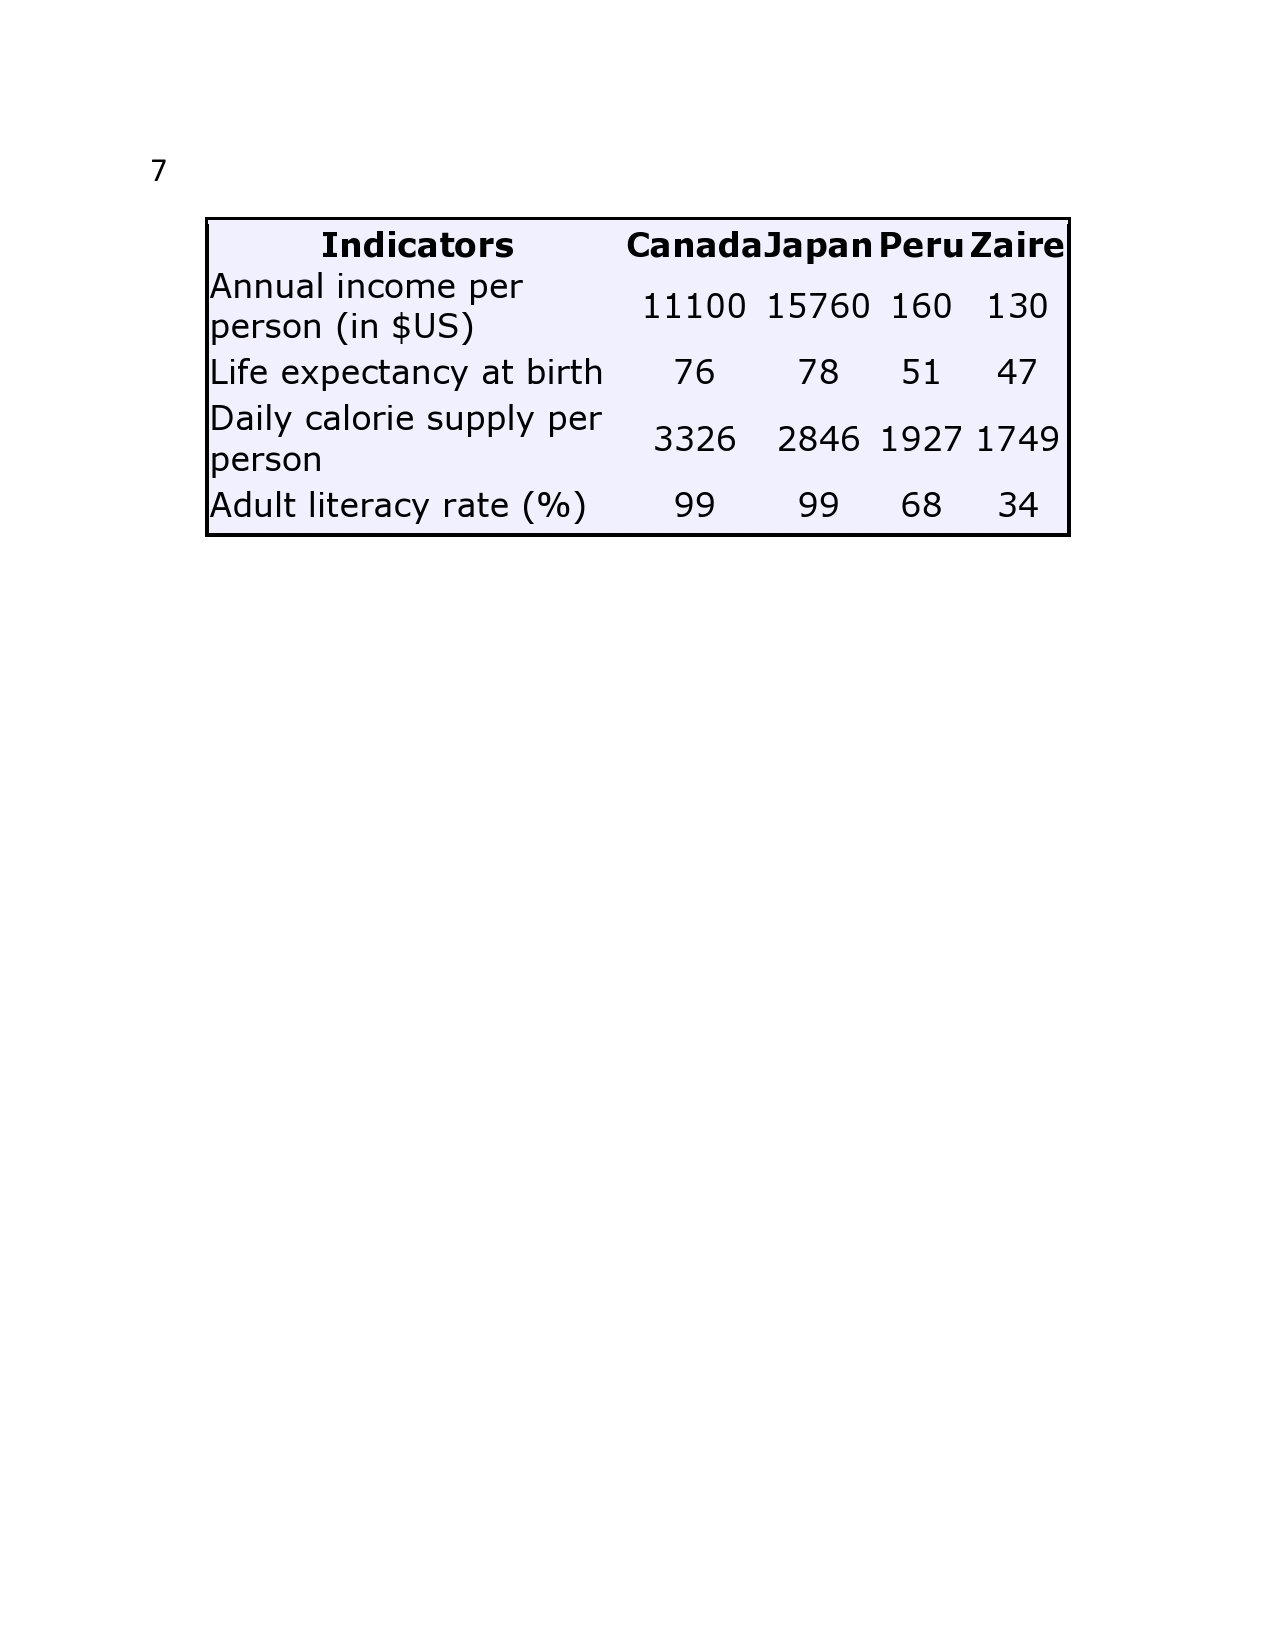
The table below shows social and economic indicators for four countries in 1994, according to United Nations statistics.
Describe the information shown below in your own words. What implications do the indicators have for the countries?
- You should write at least 150 words.
- Allow yourself 20 minutes for this task.
The given table chart illustrates the social and economic indications of Canada, Japan, Peru and Zaire in the year 1994. At a glance, in these four indicators Japan shows the highest level except daily caloric supply per person, whereas Zaire displayed the least in these four countries according to US statistics.
Turning to detail, while comparing Canada and Japan, annual income per person (in $us) Japan showed the highest level, 15760, which is followed by Canada 111000. In life expectancy of the people in these countries there was a negligible difference, at the same time adult literacy rate was same 99%. The caloric supply per person, the difference between the Canada and Japan was only 500.
While comparing Peru and Zaire in all four sectors Peru had high levels than Zaire. The differences between Peru and Zaire in annual per person income is 30$US, Life expectancy at birth was four, daily caloric supply pr person was 178 and adult literacy rate was 50% more.
In short, in developed countries, Japan and Canada all these four categories showed high disparity compared to poor countries Peru and Zaire.
The table below shows social and economic indicators for four countries in 1994, according to United Nations statistics.
Describe the information shown below in your own words. What implications do the indicators have for the countries?
- You should write at least 150 words.
- Allow yourself 20 minutes for this task.
Describe the information shown below in your own words. What implications do the indicators have for the countries?
- You should write at least 150 words.
- Allow yourself 20 minutes for this task.
The given table chart illustrates the social and economic indications of Canada, Japan, Peru and Zaire in the year 1994. At a glance, in these four indicators Japan shows the highest level except daily caloric supply per person, whereas Zaire displayed the least in these four countries according to US statistics.
Turning to detail, while comparing Canada and Japan, annual income per person (in $us) Japan showed the highest level, 15760, which is followed by Canada 111000. In life expectancy of the people in these countries there was a negligible difference, at the same time adult literacy rate was same 99%. The caloric supply per person, the difference between the Canada and Japan was only 500.
While comparing Peru and Zaire in all four sectors Peru had high levels than Zaire. The differences between Peru and Zaire in annual per person income is 30$US, Life expectancy at birth was four, daily caloric supply pr person was 178 and adult literacy rate was 50% more.
In short, in developed countries, Japan and Canada all these four categories showed high disparity compared to poor countries Peru and Zaire.
The table below shows social and economic indicators for four countries in 1994, according to United Nations statistics.
Describe the information shown below in your own words. What implications do the indicators have for the countries?
- You should write at least 150 words.
- Allow yourself 20 minutes for this task.

7page0001.jpg
