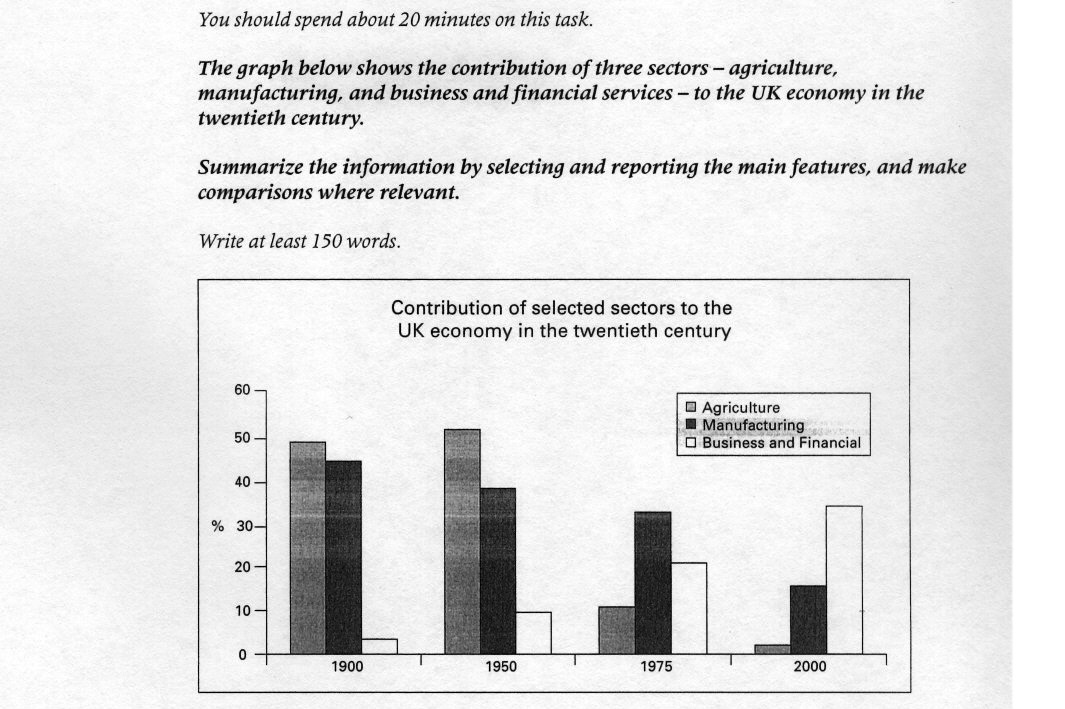
The chart describes the percentage of three different categories in the Britain economy during the hundred-year period from 1900 to 2000.
As can be seen clearly, the most striking feature of the chart is that there was a dramatic increase in business and financial through the period, rising from 4 percent in 1900 to just under 10 percent in 1950. However, in 2000, the figure for this sector was by far the highest at 35 percent.
The number of agriculture showed a considerable fluctuation. The percentage was just under 50% by 1900, but after reaching a peak of about 52%, the category suddenly fell to almost zero by 2000.
There was a significant decrease in manufacturing from about 45 percent to 15 percent. This decline was particularly noticeable between 1975 and 2000, during which time the contribution of manufacturing just over doubled.
To sum up, although business and financial was popular in 2000, the gap between the three types narrowed considerably over a 100-year period.
 Do You Need