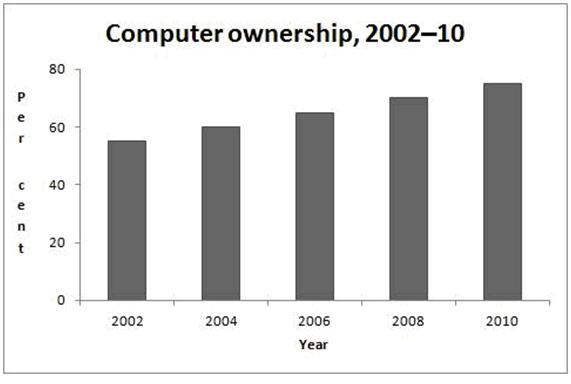
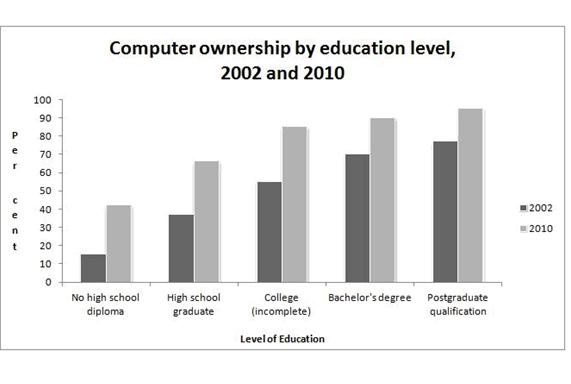
The graphs show the information about computer ownership as a percentage of the population compare with level of education in 2002 and 2010.
Generally, percentage of people who have computer increased from 2002 to 2010 and it is same as computer ownership by education.
In the graph 1, we can see that the percentage of computer ownership increased every year, started just under 60% in 2002 until nearly 80% in 2010.
In the other side, graph 2 has explained about several computer ownerships by education level. High school graduate has value about 35% (2002) and 65% (2010). For college (incomplete) has percentage of 55% (2002) and 85% (2010). While for bachelor's degree has percentage of 70% (2002) and 90% (2010)
To summary, the highest percentage has number about 80% (2002) and 90% (2010) for postgraduate qualification. Although the lowest percentage, of number about 15% (2002) and 40% (2010) for no high school diploma.

Computer_ownership_2.jpg
Computer_ownership_2.jpg
