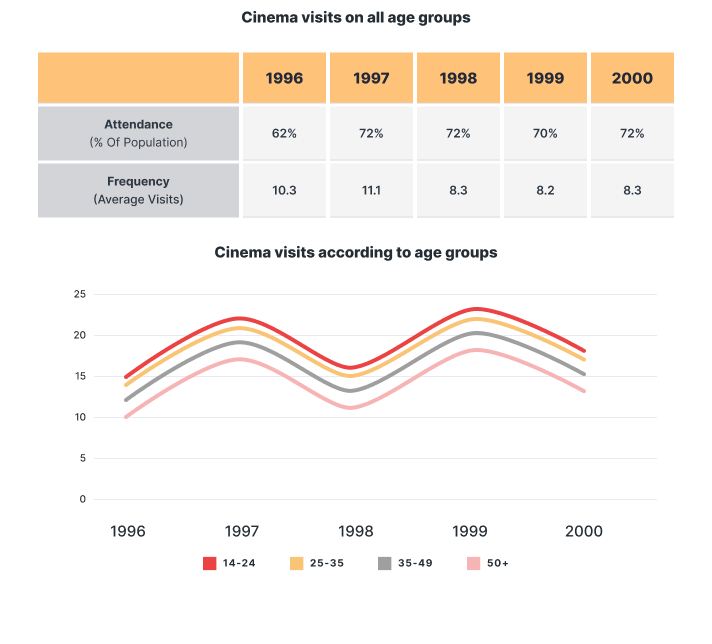
Task 1: The graphs below show the cinema attendance in Australia and the average cinema visits by different age groups from 1996 to 2000.
The graphs demonstrate the percentage of the Australian population visiting the cinema and their average visits categorized by age groups from 1996 to 2000.
Generally, cinema popularity had increased after four years with the number of times people go to a cinema falling as they age.
According to the table, the attendance of cinema visits in Australia started at 62% with an average of 10.3 visits per year. Then, there was a substantial uptick as attendance and frequency had respectively rose 10% and 0.8 times. The following two years witnessed a decline in both areas the figure for attendance lowered by 2% in 1997 and average visits dropped dramatically down to 8.2 times in 1998, but the numbers both recovered in 2000.
As can be observed in the line graph, the youngest age group had the most visits, peaking at 23 times in 1999 and hitting a bottom of 18 times in the final year. Ranging from 12 to 22 visits, adult people from 25 to 49 ranked second and third respectively. Finally, the middle-aged group visit count was 13 times in 2000.
P/s: may I ask how to choose the information to put in writing when there is too much data? I struggled with this for an hour since my weakness is task 1. I really really appreciate your efforts to give me feedback. Thank you!

The graph
