Unanswered [1]
  

Home / Writing Feedback   % width   Posts: 3


[IELTS 1] The graphs show the differences between enrolments of overseas students and local students


countryno81 1 / 1  
Jun 28, 2021   #1

Overseas students and local students in Australia


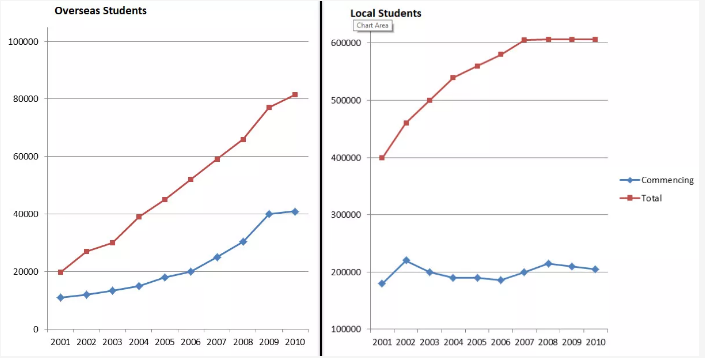
THE GRAPHS BELOW SHOW THE ENROLMENTS OF OVERSEAS STUDENTS AND LOCAL STUDENTS IN AUSTRALIAN UNIVERSITIES OVER A TEN YEAR PERIOD.

SUMMARISE THE INFORMATION BY SELECTING AND REPORTING THE MAIN FEATURES, AND MAKE COMPARISONS WHERE RELEVANT.

The graphs show the differences between enrolments of overseas students and local students.
First of all, we easily see that the number of overseas students has increased for ten years. In contrast, the number of local students has stayed almost the same and stable population can be a reason account for it.

On the graph that shows us information about overseas students, we see that there was numerous of overseas students increased between 2006 and 2009, for details, 2000 students came to Australia for university within three years. After that, we still can see the increasing tendency. On the other hand, the line on the second graph doesn't show us any idea or any tendency. We can easily see that the number of students has decreased for 3 years, from 2008 to 2010.

To sum up, the differences between the number of overseas students and local students are not only the tendency but also the enrolments.

  • I.PNG


Holt  Educational Consultant - / 15475  
Jun 29, 2021   #2
The summary of information is incomplete as it does not offer :
- proper graph type identification
- Measurement years indicator
- Type of measurement used

There is a missing analysis paragraph for the second image in relation to the incoming and graduating students. The presentation should have presented that as a 4th paragraph.

It appears that the miter failed to properly review the given images. The writer was in a rush to complete the essay on only the most basic level. Not understanding that a deeper analysis would have increased the C + C score for the essay. In fact, having written such a short essay of only 156 words severely limits the score for this essay. A lengthier version of 175 words would have been better for the final score.
Penelopee 3 / 5  
Jul 1, 2021   #3
In the first line, you should paraphrase the key words and express the information more flexibly. You can replace the word "show" by using others like "clarify", "reveal" . Moreover, you should clearly show graphs are the "Line Graphs". There is a lack of time/period and area/location in your first line.

In the second passage, you should use the word like "To sum up" or "In conclusion" rather than "First of all" to summarize the while content of your essay.

In the third passage, You should divide "Local students" and "Overseas students" into 2 seperate passages. In addition, you should not repeat the expression which you used in previous line. Instead, you shoud use the flexible transition such as "Turning to", "As regards" or " With preference to" in order to create the cohesion in your essay. When mentioning any period or single year, you should give the clear figures to prove the information.

In the task 1 Ielts Writing, you only need to write the summary once.
That is my feedback. Hope you feel useful. Have a good day :)


Home / Writing Feedback / [IELTS 1] The graphs show the differences between enrolments of overseas students and local students
ⓘ Need Writing or Editing Help?
Fill out one of these forms for professional help:

Best Writing Service:
CustomPapers form ◳

Graduate Writing / Editing:
GraduateWriter form ◳

Excellence in Editing:
Rose Editing ◳

AI-Paper Rewriting:
Robot Rewrite ◳